“Mineral Security” Policy for Electric Vehicle Battery Minerals
This report analyzes the geopolitical and economic risks associated with minerals important to electric vehicle batteries.
Abstract
This paper discusses the nature of quantity and price risks from the exercise of market power over critical minerals, with an emphasis on the minerals used for electric vehicle (EV) batteries. The focus is especially on risks involving China since that country holds large shares in the processing and extraction of several battery minerals. Quantity risk is the threat of selective interruptions in the supply of critical minerals available to target countries. Price risk is the threat of higher prices by restricting supplies to the market as a whole, thereby extracting economic rents from buyers. Key findings include that (i) China is unlikely to be able to control market allocations of battery minerals to implement selective supply cuts, (ii) China tends to overbuild mineral processing capacity to safeguard domestic supply chains, and that (iii) China has engaged in export price discrimination for certain critical minerals, but care is needed in comparing this risk to the risk involved with massive investment in non-Chinese mineral processing capacity.
JEL numbers: Q37, Q34, F52
Key words: critical minerals. electric vehicle batteries. market power. industrial policy.
1. Introduction
While the concept of “mineral security” for US critical minerals is interpreted in different ways, concerns about their availability arise frequently. This follows from the definition of “critical minerals”: non-fuel minerals that play an important role in the economy or national security, are challenging to replace at least in the nearer term, and are subject to some notable possibility of decreased availability (National Research Council 2008).
Two types of concern about critical mineral security are found in policy debates. Both involve actors with large market shares in the extraction and/or processing of some critical minerals. One is the threat of selective interruptions in the quantity of critical minerals available to particular target countries due to geopolitical conflict. The other is the threat of higher prices from the exercise of market power over supplies by restricting outputs, thereby extracting economic rents from buyers. “Economic rents” is a term used by economists to describe profits gained by the exercise of market power, beyond the normal returns on capital and payments for other inputs. This exercise of market power also can involve “predatory pricing”—flooding the market to drive prices down when there is a threat of competitive entry. Some observers would add concerns over price volatility, the commonplace upward and downward movements of prices that are different than predatory price drops. Critical mineral price volatility is seen as amplifying financial/investment risks for new investments in critical minerals extraction or processing. However, price volatility is ubiquitous in commodity markets—especially markets for critical minerals, which tend to be thin and opaque and have inelastic nearer-term supplies and demands. Rapid growth in Chinese processing capacity to a huge scale, even to the point of apparent global over-capacity, has become a subject of concern (DOT 2024; European Commission 2023).
This paper discusses the nature of quantity and price risks from the exercise of market power with a focus on critical minerals used for electric vehicle (EV) batteries. These include cobalt, graphite, lithium, manganese, and nickel. The focus is especially on risks involving China since that country holds large shares in the processing and/or extraction of several battery minerals compared to the rest of the world (ROW) (see Spiller, Kannan, and Toman 2023). The arguments in the paper are based on a mixture of logical reasoning, information about mineral supplies and markets, information about Chinese industrial policy, and off-the-record consultation with several industry experts involved in different parts of critical mineral supply chains.
2. Overview of Critical Mineral Availability Risks
The geopolitical concern involves the threat of supply reductions or interruptions targeted at specific countries. Such restrictions certainly would have economic consequences. The seriousness of this threat depends critically on the degree of targeting that is possible, which depends in turn on the ability to limit resale and transshipment.
The economic concern is that a country with a large share of mineral production and/or processing could use its market power to raise prices, along with price cuts when needed to deter competing suppliers from expanding. One way to exercise market power is to restrict outputs of processed minerals, raising prices for all purchasers—domestic and foreign. In this case, the economic rents gained from raising prices to foreign purchasers need to be balanced against adverse effects on domestic purchasers. The other way to exercise market power is through price discrimination, restricting exports so that prices to foreign purchasers exceed prices to domestic purchasers. We discuss both types of market power below.
Competition from others depends on how quickly competitors can expand their output if prices are above costs. Although supply elasticities (the percentage response of supply to a particular percentage increase in price) tend to be low in the short term, markets can adjust over longer periods. In the medium-to-long term, an upper bound on the price that can be charged to extract economic rent is a sustained price sufficient to draw competitors into the industry.
3. Critical Mineral Quantity-Availability Risks for Battery Minerals
Scant historical evidence exists for successful imposition of targeted supply restrictions. Observers have pointed to the fall of 2010, when China stated it was reducing exports of some rare earth elements (REEs) over an unrelated dispute with Japan. Prices for those elements increased tenfold and did not decline until partway through 2011. However, data on Japanese imports during the period indicate no sudden and dramatic shortfall in deliveries to that country (Johnston 2013, 24–26; Evenett and Fritz 2023, 32–33). Evenett and Fritz (2023) further show that there is no solid evidence of selective supply cuts to any buyer of REEs from China over the period 2010–2019. In practice, any restrictions in Chinese exports affected the global market as a whole, not individual countries.
For battery minerals, the structure of the markets makes it unlikely that a targeted restriction on supplies could be sustained. These minerals largely are traded through a significant number of bilateral trade agreements between individual suppliers and purchasers. It would be very difficult for China to prevent resale of materials to countries affected by targeted restrictions, which would in effect become restrictions on availability to the market as a whole. The December 3, 2024, edition of the New York Times reported that China was stopping sales to the United States of several non-battery critical minerals including gallium, germanium, and antimony. Exports of graphite (a battery mineral) would continue but with increased scrutiny (David Pierson, Keith Bradsher, and Ana Swanson, “China Bans Rare Mineral Exports to the U.S.,” the New York Times, December 3, 2024, https://www.nytimes.com/2024/12/03/world/asia/china-minerals-semiconductors.html). Subsequently, China ordered customers from other countries not to allow transshipments to the United States (Keith Bradsher, “China’s Critical Minerals Embargo Is Even Tougher Than Expected,” the New York Times, December 9, 2024, https://www.nytimes.com/2024/12/09/business/china-critical-minerals.html). Time will tell how much China can in practice effectively embargo critical mineral supplies to selected countries, given the workings of the markets for the affected minerals.
4. Evidence Relevant to Understand China’s Investment and Pricing Decisions in Lithium and Cobalt Markets
4.1. Lithium: Data on Capacity, Capacity Utilization, and Prices
The data in this subsection and the next come from Roskill Information Services (2019, 2020a, 2020b), and from various years of annual lithium and cobalt statistics from the USGS National Mineral Information Center. Because the Roskill data are proprietary, absolute quantities from this source cannot be revealed.
China’s domestic production of lithium at the extraction stage has been in the range of 15–24 percent of the global total during the period 2011–2023 (Roskill Information Services 2020a, 2020b; USGS 2012–2024). Extraction of lithium occurs largely from two types of deposits—so-called surface brine and hard rock. Extraction from brine deposits involves concentration of the brine in solar evaporation ponds and then further chemical processing to produce refined lithium. Hard rock–based operations primarily involve lithium-bearing ores, the most valuable of which is spodumene. Processing of lithium from hard rock based minerals involves various processes to obtain lithium concentrate, which is further refined to lithium chemicals (Warren 2021). China does not have significant comparative advantages (technological or geological) for extracted lithium. Nonetheless, China has continued to build domestic capacity for both brine and hard rock lithium extraction.
China’s share of lithium refining capacity has grown from 44 percent in 2013 to almost 76 percent in 2020 (Figure 1). Chinese capacity has grown at an average annual growth rate (AAGR) of 33 percent from 2013 to 2020 (Figure 2). During this same period, the capacity for refining lithium in ROW has grown at an AAGR of approximately 10 percent, consistent with the decline of its share from 56 percent to 24 percent (Figure 1). Thus, while ROW roughly doubled capacity for refining lithium, China’s capacity increased 7.5 times. Similar trends hold for quantities of refined lithium production as well, with China’s share in global refined production at approximately 65 percent in 2020.
Figure 1. Refined Lithium Capacity Share

Sources: Roskill Information Services 2020a, 2020b; US Geological Survey (USGS)—various years.
Figure 2. Refined Lithium Capacity

Note: Figure 2 shows relative growth in capacities, with Chinese and Rest of World (ROW) capacities normalized to 1.0 in 2013.
Sources: Roskill Information Services 2020a, 2020b; US Geological Survey (USGS)—various years.
Figures 1 and 2 do not separate brine and hard rock refining capacities. ROW has higher brine capacity than China, although China’s has continued to build. However, China overwhelmingly dominates global refining capacity for hard rock–based lithium.
Figure 3 compares capacity utilization for lithium refining between China and ROW over 2013–2020. It shows that China’s capacity utilization has largely ranged between 40 and 60 percent, with a downward trend from around 60 percent in 2013 to around 40 percent in 2020. The capacity utilization for the ROW has been higher, hovering around 80 percent for most of that period.
Figure 3. Capacity Utilization for Refined Lithium

Sources: Roskill Information Services 2020a, 2020b; US Geological Survey (USGS)—various years.
Figure 4 compares global lithium use, Chinese use, and China’s and ROW’s refined lithium capacity over 2013–2019. The figure suggests that from 2013 to 2015, total (Chinese and ROW) refining capacity grew in line with global lithium use. In 2015, however, the pace of growth in Chinese refining capacity increased, leading to excess global capacity. After 2017, China’s refining capacity significantly exceeded global use of refined lithium (by greater than 150,000 tonnes lithium carbonate equivalent). This implies aggressive growth of processing capacity, faster than growth in demand for refined lithium. One puzzle is why Chinese refining capacity grew so much while capacity utilization rates declined (Figure 3). Figure 4 also shows a pickup in the growth of demand for refined lithium after 2017.
Figure 4. Normalized Global and Chinese Use of Refined Lithium

Note: All four data lines are shown in indexed form. The indexing was carried out as follows: (a) in 2013, Chinese capacity was indexed to 1.0 and the other three figures were normalized relative to that; and (b) for 2014–2020, each of the four data lines was constructed by using the ratio of current to previous-year values.
Sources: Roskill Information Services 2020a, 2020b; US Geological Survey (USGS)—various years.
Figure 5 graphs global refined lithium production (Chinese and ROW) and the price of lithium over 2013–2020. The lithium price was stable from 2013 to 2015 but increased substantially between 2015 and 2018. Chinese processing capacity and output began to grow more rapidly from 2015 to 2017, which presumably moderated the subsequent price increase (Figures 4–5). However, Chinese processing capacity continued to grow from 2017 to 2020, and actual output grew over the same period even though the rate of capacity utilization was declining (Figure 3). The inevitable result was a significant decline in the price of refined lithium over 2018–2020. Lithium prices also shot up from 2021 to 2022 before falling back somewhat in 2023. Similar to the pattern shown in Figure 5, Chinese lithium processing capacity steadily grew over this entire time.
Figure 5. Refined Lithium Production and Price of Lithium

Note: Metric tonnes of lithium carbonate equivalent production numbers are indexed, using the same approach outlined in Figure 4.
Sources: Roskill Information Services 2020a, 2020b; US Geological Survey (USGS)—various years.
4.2. Cobalt: Data on Capacity, Capacity Utilization, and Prices
China is an insignificant producer of cobalt at the mining stage, with an output share of about 1–2 percent throughout the period 1999–2022 (USGS 2000–2023). In contrast, Figures 6 and 7 show that China’s capacity for refining cobalt has grown from a mere 2.6 percent share in 1999 to almost 67 percent in 2021. The AAGR for cobalt refining capacity in China for this period has been approximately 24 percent, whereas the ROW’s AAGR for the same period has been a mere 1.8 percent. ROW’s cobalt refining capacity share in the world fell from 97 percent to 33 percent. Similar trends hold good for refined cobalt output as well, with China’s share in global refined production at around 74 percent in 2021.
Figure 6. Refined Cobalt Capacity Share

Sources: Roskill Information Services 2019; US Geological Survey (USGS)—various years.
Figure 7. Refined Cobalt Capacity

Note: Figure 7 shows relative growth in capacities, with Chinese and Rest of World (ROW) capacities normalized to 1.0 in 2004.
Sources: Roskill Information Services 2019; US Geological Survey (USGS)—various years.
Figure 8 compares cobalt refining capacity utilization between China and ROW over 1999–2021. It shows that unlike the case for lithium, China’s cobalt refining capacity utilization has largely shown an upward trend, rising from 20 percent in 1999 to meet ROW at 60 percent in 2012, and then consistently surpassing ROW in the following years. It grew to 100 percent in 2015 before falling to around 60 percent in 2019. Capacity utilization for the ROW has been largely flat, in the range of 60 percent. Figure 9 shows that China’s cobalt refining capacity has risen at an increased rate since 2015 and slightly surpassed global cobalt use in 2019.
Figure 8. Capacity Utilization for Cobalt

Sources: Roskill Information Services 2019; US Geological Survey (USGS)—various years.
Figure 9. Normalized Chinese and Global Use of Refined Cobalt

Note: Data are indexed using the same approach outlined in Figure 4.
Sources: Roskill Information Services 2019; US Geological Survey (USGS)—various years.
In Figure 10, the line for the price of refined cobalt shows two significant runups, from 2002 to 2008 (with some retrenchment in 2004–2005) and again from 2016 to 2018. China’s production during the first period started small but grew substantially until 2010, even though the price dropped significantly in 2009. We cannot say that China’s continued growth in output caused the price drop given other factors, such as the global financial crisis and recession at that time, but it presumably contributed to some extent.
Figure 10. Refined Cobalt Production and Price
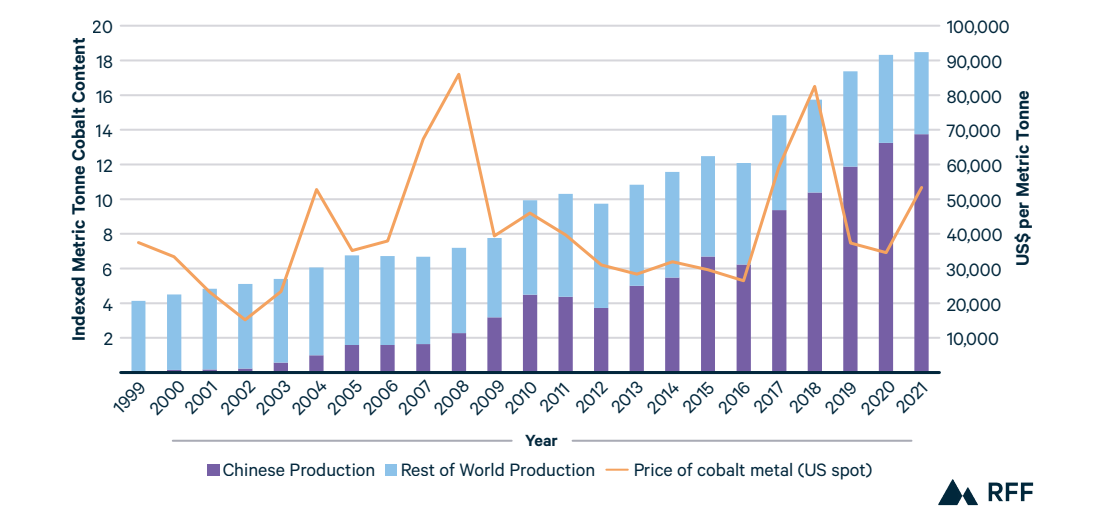
Note: Production numbers are indexed using the same approach outlined in Figure 4, except the normalizations are centered on 2004 rather than 2013.
Sources: Roskill Information Services 2019; US Geological Survey (USGS)—various years.
Chinese production resumed its increase in 2012 and surpassed ROW production, even though the price of refined cobalt was stagnant until 2016. Subsequently, Chinese output grew dramatically, even after the price peak in 2018. The continued rise in Chinese output presumably contributed to the price decline. The rate of capacity utilization declined after 2016 (Figure 8), meaning that the very large output increases thereafter can be attributed to new capacity being built (Figures 6–7).
Figure 11. Chinese Steel Production and Iron Ore Imports

Note: Implied Domestic Iron Ore Production (import equivalent): pig iron consumption implied iron unit demand less imports, plus stock changes and transformed to be equivalent to imported ore characteristics (moisture and iron content)
Source: Rio Tinto 2016.
Figure 12. Chinese Aluminum Production and Bauxite and Alumina Imports

Source: Rio Tinto 2014.
5. What Do the Lithium and Cobalt Data Suggest?
The data show that China has built huge new capacity over the past decade for refining lithium and cobalt. The scale of this buildup resembles the country’s growth in steel and aluminum in earlier phases of its massive industrialization effort (Figures 11–12). In both those industries, China increased its imports of raw materials over time to expand processed metal production, rather than importing processed metals from others.
The data we examined also indicate that China did not raise processed lithium or cobalt prices to garner economic rents when it seemed it had the ability to do so. Instead, its processing capacity and output increased as prices rose and continued to increase even after prices fell back. The exercise of market power would have entailed restricting output, especially while prices were rising, to further increase them, thereby extracting more economic rent.
The lithium data also indicates that when prices were coming down, capacity continued to grow, but capacity utilization declined. If China had been flooding the market to drive out competitors, one would have expected an output surge to be associated with increased processing capacity utilization.
The pattern for cobalt also shows growing capacity even as prices declined. However, capacity utilization grew over time. It is important to note here that a substantial amount of cobalt is a by-product of copper and nickel extraction. China’s efforts to increase production of copper in mines that also produce cobalt automatically leads to increased supply of cobalt (Critical Minerals Forum 2024). Therefore, the presence of a supply glut for cobalt when demand for copper also is rising makes it more difficult to interpret the cobalt price and production data.
6. What Else Might Be Going On?
Previously we questioned the extent to which China could target restrictions on quantities of battery materials available, the main channel through which geopolitical influence on processed minerals might be exerted. Regarding economic market power, an alternative to the common narrative stems from another widely shared observation, that a priority concern for China is maintaining supply chains to satisfy growing input demands from its own expanding manufacturing base. However, in determining the amount of capacity to build for battery mineral processing, China has been prone to overshooting.
In our context, the ready and secure availability of processed battery minerals is significant for China’s high-priority EV components manufacturing and vehicle assembly sectors. The high priority accorded to those sectors engenders aggressive investment in processed input availability to avoid bottlenecks, rather than limiting output to garner economic rents. That in turn imparts a bias in favor of over-investment. Excess capacities also can result from tendencies toward lumpiness in investment implementation and imprecision in centrally derived estimates of required capacity.
In short, China may be a “clumsy catalyzer” for expansion in capacity. Over some periods, for example, more than 100,000 tonnes of lithium-processing capacity have been “placed under care and maintenance” (idled but maintained) in China (Roskill Information Services 2020a). Some excess capacity has been utilized, and the result has been lower prices, but this does not necessarily reflect predatory behavior to limit competition.
However, our analysis has not yet addressed Chinese practices in price discrimination. The lithium and cobalt price data examined previously do not reflect potential differences between domestic and export prices. China has been found responsible for practicing international price discrimination in a World Trade Organization case involving non-battery minerals initiated by the United States in 2012 and resolved in favor of the United States in 2014. See https://www.wto.org/english/tratop_e/dispu_e/cases_e/ds431_e.htm. China’s claim that it needed to restrict exports but not domestic uses to mitigate resource depletion was not accepted. Clarke (2024) provides a more recent example of this in the context of antimony, where the tightening of export availability derived from depletion of Chinese mine reserves. China also has indirectly practiced price discrimination by imposing export restrictions for some minerals to meet domestic mineral requirements, consistent with a “China First” approach to protecting domestic supply chains for critical minerals (IEA 2024; Reuters 2024).
Our analyses of lithium and cobalt price trends suggest that China is not withholding supplies from the market as a whole, but this does not rule out price discrimination to favor domestic over foreign customers for refined battery minerals. This would be China’s preferred approach to using market power since withholding supplies from the market as a whole would raise prices for domestic customers, and the impacts would be inconsistent with China’s industrial policy for the EV sector.
Unfortunately, obtaining domestic Chinese sales prices to compare with international prices is not easy. Recent spot price information for lithium from the organization Fastmarkets indicates ranges of delivered prices to Northeast Asia, Europe, and North America that are below price ranges in China for spot quantities. See Fastmarkets, Dalila Ouerghi, and Zihao Li, “China’s Lithium Prices Continue Downtrend Amid Weak Futures Market,” Fastmarkets, April 2, 2024, https://www.fastmarkets.com/insights/chinas-lithium-prices-continue-downtrend-amid-weak-futures-market/. However, all we can say is that price discrimination could again become an issue. It will be less of an issue to the extent that spot markets grow in volume and lead to greater price transparency in other mineral sales agreements.
7. China’s Lead in Battery Minerals Processing
Given that global concentration in battery mineral processing is a concern, why is China so far ahead in the buildup of processing capacity? With the partial exception of graphite, to which we return below, no inherent barrier on the technology front inhibits geographical diversification in the processing of battery minerals. Part of the reason may be that China seems to move first, before ROW, even if its investment goals miss the mark. Operating at relatively low rates of capacity utilization does not seem to be a strong deterrent for China.
This raises the broader question of how Chinese companies recover their capital costs. Some experts with whom we have spoken indicated that Chinese companies do not have the same concerns over recovering capital costs that are common in a market economy. Our interlocutors indicated that China provides different forms of reduced-cost capital once a sector is deemed to be a priority (see Liu et al. 2020 for discussion of this in the context of the Chinese EV industry). To the extent this is true for domestic battery minerals suppliers in China, companies in the Chinese EV sector using those minerals gain a significant cost advantage. However, so do foreign companies that import those minerals. Debate over unfair advantages for Chinese EV makers is very different to concerns over rent-garnering in battery minerals markets.
8. Policy Implications
A paradox is built into the 2022 Inflation Reduction Act (IRA) with respect to critical minerals and EVs. The IRA provides incentives to EV purchasers favoring battery and vehicle manufacturing in the United States. However, those incentives are made more complicated if, as recently occurred, Chinese companies with desirable battery technologies are blacklisted (such as CATL, a major Tesla supplier and Ford’s erstwhile technology consultant for domestic battery manufacturing). See Ellen Nakashima and Cate Cadell, “Pentagon to Blacklist China’s Largest Battery and Tech Firms,” the Washington Post, January 6, 2025, https://www.washingtonpost.com/national-security/2025/01/06/pentagon-blacklist-china-technology-ev/. These policies force the United States to do more from scratch, raising costs. However, those policies also disfavor using Chinese sources of critical minerals for the EVs. This essentially guarantees higher costs over numerous years for battery and EV makers in the United States, given China’s current lead in battery minerals supply, unless government subsidies close the gap. The investment outlays for non-Chinese processing capacity would be substantial, and the facilities would have to recover their capital costs unless they receive government support. Total processing costs might be lower if the new facilities were located in a friendly middle-income country. Those higher costs in turn will raise the costs of EVs and reduce incentives for adopting them.
Our analysis leads us to several policy conclusions:
- We have argued that there is little prospect that China could enforce a selective restriction on supplies of battery minerals to the United States. Accordingly, the focus should be less on physical availability of mineral quantities, and more on critical mineral pricing. The same argument can be applied to other critical minerals, except perhaps in some very thin markets.
- China does have a history of export price discrimination in some critical minerals. Importers from the United States and other countries could press China for greater transparency in pricing of minerals in current bilateral contracts. This could include specifying prices as “Free on Board” (FOB) in a Chinese port, and quoting prices in USD. Buyers also could seek information on domestic pricing of battery minerals for comparison with export pricing—though the prospects for that are unclear. If price discrimination is found, then one option for non-Chinese battery mineral purchasers is tariffs on Chinese EVs to correct for it. However, such tariffs would not justify exclusion of Chinese EVs, as the United States has done with its tariffs on Chinese EVs. Excluding Chinese EVs on national security grounds is a separate issue.
- The ultimate remedy for the risk of export price discrimination by China in battery mineral markets is increased competition from non-Chinese sources of mineral processing (along with reduced mineral demands from technical innovation). This will take time. There already is reasonable geographic diversity in raw battery mineral reserves (Spiller, Kannan, and Toman 2023). Meanwhile, either direct costs for battery minerals will be higher due to reliance on the alternative sources, or federal subsidies will increase (well beyond those currently offered under the IRA) to the alternative sources to hold down their prices. The uncertain-sized risk of price discrimination needs to be carefully weighed against the risks associated with massive and rapid build-out of new capacity through “onshoring” and “friendshoring.”
- It is important to recognize limits to China’s ability to hike prices because of possibilities for competitive entry over the longer term if prices go up. With lithium, for example, the United States could invest in processing capacity for hard rock lithium ore from Australia and lithium-containing brines from Latin America. China prefers these over its own lower-quality resources that are costlier to process. Accordingly, these sources also might be able to raise raw material prices to recapture some economic rents from Chinese price markups, helping deter such markups. We have noted that graphite is different from other battery minerals because China’s share of production as well as processing is high. Along with natural graphite, China manufactures synthetic graphite, a substance produced by exposing a mixture of a carbon source (coal, oil, or petroleum coke) and a binding agent to high temperature (a relatively carbon-intensive process). It then processes extracted and manufactured graphite to fit the needs of battery component makers. While China currently dominates graphite supply, there are substantial reserves of natural graphite in several African countries and in Brazil (USGS 2024, page 85). With time, the ROW could develop alternative sources of natural graphite extraction and processing to compete with China, if that country attempted to significantly limit graphite supplies.
9. Concluding Remarks
Ultimately, whatever the risk of market power is in processing critical minerals for EV batteries, ameliorating it requires geographic diversification in sources of processing. ROW has access to the necessary technology. Based on our discussions with experts, China does not seem to have a major technology advantage in processing most battery minerals (though by virtue of having undertaken more investment, they likely have gained some valuable knowledge through “learning by doing”).
In this paper we have sought to establish two basic points. The first is that China’s ability to impose targeted export restrictions likely is significantly exaggerated in some discussions of battery mineral security. The second is that China’s competitive advantage in battery mineral processing derives more from the country’s industrial policy, which pushed investment in this sector to solidify domestic supply chains, than from the exercise of market power. China’s large market share does give it a capacity to raise export prices over domestic prices. However, policies for onshoring and friendshoring battery minerals—including R&D co-funding and direct and indirect subsidies, and complicated market-stabilization mechanisms (Jacobs 2024)—are likely to be quite costly.
Our arguments do not apply to all critical minerals. Rare earth elements (REEs) have important national security applications as well as civilian uses, especially in magnets. Neodymium (Nd), praseodymium (Pr), dysprosium (Dy), and terbium (Tb) are generally considered key REEs for such applications. Nd and Pr are considered light REEs, while Dy and Tb are considered heavy REEs. At present, China dominates production and processing of both types, with greater dominance in processing heavy REEs (REIA 2024). China mines greater than 70 percent and processes more than 90 percent of the light REEs, neodymium (Nd) and praseodymium (Pr), normally produced as NdPr oxide. For the heavy REEs—dysprosium (Dy) and terbium (Tb)—China mines more than 35 percent and processes greater than 99 percent (REIA 2024). As China’s share in both mining and processing stages for REEs is large, this gives China a significant competitive edge. While the United States can stockpile some REEs to mitigate shortages for national security uses, creating a new REE extraction and processing industry outside China would be very costly—especially because REE processing can be a complicated multistep process, which China already has mastered.