Global Energy Outlook 2025: Headwinds and Tailwinds in the Energy Transition
RFF’s annual Global Energy Outlook harmonizes a range of long-term energy projections to find key trends in global energy consumption, emissions, and geopolitics.


1. Introduction
As 2025 unfolds, the global economy, international alliances, and the rules-based international order face new questions and challenges. Energy markets and international climate negotiations are not immune to this turmoil and may undergo profound change as global markets and geopolitical dynamics adapt to new realities. Amid deep uncertainty on these and many other fronts, the world continues to face the enormous and pressing challenge of transforming its energy system to address global climate change.
To understand how our energy system is evolving and how it needs to change to reach net-zero emissions, each year, a variety of organizations produce projections that imagine a wide range of futures based on divergent visions about policies, technologies, prices, and geopolitics. Because these vary widely and depend heavily on varied assumptions and methodologies, they are difficult to compare on an apples-to-apples basis. In this report, we apply a detailed harmonization process to compare 13 scenarios across seven energy outlooks published in 2024 (and two historical data sources). Taken together, these scenarios offer a broad scope of potential changes to the energy system as envisioned by some of its most knowledgeable organizations. Table 1 shows the historical datasets, outlooks, and scenarios, with additional detail provided in Section 4.
Table 1. Outlooks and Scenarios Examined in This Report

A brief description of our methodology is provided in Data and Methods (Section 5), with select indicators in Statistics (Section 6). For the full methodology and interactive graphing tools, visit www.rff.org/geo.
Throughout the figures included in this report, we use a consistent labeling system that distinguishes among the different types of scenarios (see Table 2):
- For “Reference” scenarios, which assume limited or no new policies, we use a long-dashed line: this set comprises scenarios from ExxonMobil, IEEJ, and OPEC.
- For “Evolving Policies” scenarios, which assume that policies and technologies develop according to recent trends and/or the expert views of the team producing the outlook, we use solid lines: this set comprises BNEF ETS, bp Current Trajectory, and IEA STEPS. Although they do not follow the same sets of assumptions, we also include Equinor Walls and IEEJ Advanced Technologies scenarios because their CO₂ emissions trajectories are similar to other “Evolving Policies” scenarios. For IEA APS, which assumes governments implement all announced energy and climate policies, we use a dot-dash format.
- “Ambitious Climate” scenarios are not designed around policies but instead structured to achieve specific climate targets. Some limit global mean temperature rise to below 2°C by 2100 (bp Net Zero), and others limit it to 1.5°C by 2100 or aim for net-zero emissions by 2050 (BNEF NZS, Equinor Bridges, IEA NZE). For these scenarios, we use a dotted line.
Table 2. Legend for Different Scenario Types

Figures and tables in this report sometimes refer to regional groupings of “East” (Africa, Asia Pacific, Middle East) and “West” (Americas, Europe, Eurasia).
2. Key Findings
In 2024, low-emissions technologies have benefited from substantial tailwinds, with a record $2 trillion investment in clean energy technologies and infrastructure in 2024, accelerating renewable power deployment and energy efficiency improvements. However, significant headwinds to the energy transition remain as global CO₂ emissions reach record highs, and the benefits of energy investments are distributed unevenly. Growing challenges also come from the prioritization of energy security, a new direction in energy and climate policy from the United States, and surging electricity demand from emerging technologies, such as artificial intelligence (AI) (this report examines scenarios prepared before the US 2024 election).
The record investment in clean energy deployment is largely driven by accelerated electrification and global electricity demand, which is projected to grow substantially across scenarios. Under all scenarios, renewable energy sources, led by wind and solar, are more than 50 percent of electricity generated in 2050. Fossil fuel generation remains roughly flat or declines across scenarios, but the degree of decline and share of generation in 2050 depends on the scale of climate ambition.
Figure 1. World Electricity Generation Grows Rapidly, Led by Wind and Solar

Notes: 2050 scenarios ordered from highest to lowest total levels of fossil fuel generation.
Electricity demand will continue to grow across the economy, particularly in the buildings and transportation sectors, with the speed of their electrification depending in large part on policy decisions. At the same time, wind and solar are now the cheapest sources of electricity in many markets. Although both have grown rapidly in recent years, renewable energy (wind, solar, biomass, and hydro) supplied less than half of the more than 14,000 TWh of increased electricity generation from 2000 to 2023, with most of the remainder met by coal and natural gas.
Electricity generated from coal declines under all scenarios by 2050, ranging from a decrease of 35 percent (IEEJ Reference) to 94 percent (bp NZE and IEA NZE) relative to 2023. For electricity from natural gas, projections vary much more widely. Under Reference and Evolving Policy scenarios, it remains flat or grows substantially, from a 7 percent decline (BNEF ETS) to an 83 percent increase (IEEJ Reference) between 2023 and 2050. Under Ambitious Climate scenarios, it falls but is not fully eliminated, often pairing with carbon capture or negative emissions technologies.
Under all scenarios, electricity from solar and wind grow substantially, accounting for 37–74 percent of world generation by 2050. Their distribution has not been evenly spread across regions. Three regions (United States, Europe, and China) have accounted for around 75 percent of total solar capacity—with China alone accounting for more than 60 percent of capacity growth in 2023.
Figure 2. Percentage of Total Solar Capacity by Region (US, Europe, China, ROW)

Notes: Historical data from IEA. Projections are taken directly for IEA. Projections for other organizations are estimated based on an organization’s generation projections, converted to capacity assuming capacity factors imputed from the IEA APS.
Under Reference and Evolving Policies scenarios that provide regional solar data (bp, IEA, and IEEJ), other regions make up a larger share of total deployment by 2050. From 2023 to 2050, the compound average annual growth rate (CAAGR) for the rest of the world ranges from 6.7 percent (IEEJ Reference) to 12 percent (IEA APS and bp NZE) and outpaces that in the United States, Europe, and China in all scenarios. However, high cost of capital and project risk in developing countries, coupled with the relatively low cost of fossil fuels, may slow renewable energy growth.
Much analysis over the last year has focused on the role of AI and associated electricity demand from data centers. Although data centers have been a source of electricity demand for years, the rapid growth and prevalence of AI tools has generated headlines and the potential headwinds of massive load growth, especially in the United States, Europe, and China. Figure 3 compares electricity generation in projections from the last two years against the most recent outlooks from IEA and IEEJ.
FIgure 3. Previous and Current Projected Electricity Generation from IEA and IEEJ

Notes: Historical data from IEA.
US electricity supply in 2035 is projected to be 3 percent higher in the 2024 STEPS scenario compared with 2023. By 2050, IEA projects generation to be 7 percent higher than the prior year’s scenario while IEEJ projects generation to be 9 percent higher than the 2023 Advanced Technology. Although this is a significant upward revision, data center growth is only a small part of total growth in US electricity needs. In IEA’s STEPS scenario, the buildings sector (which includes data centers) accounts for only 11 percent of the increase in generation to 2035, and the impact of data centers is assumed to be “modest relative to other sectors.” The transportation and industrial sectors contribute much more significantly to overall demand growth.
In the EU and China, electricity generation in IEA STEPS was also revised upward compared to previous years. However, IEEJ revised its outlook downward for these regions in 2024 after a significant upward revision in 2023.
Of course, these projections contain a high degree of uncertainty and, in general, do not match recent analysis from more bullish industry experts. For instance, Wood Mackenzie’s base case modeling suggests that data center expansions could increase the sector’s global electricity consumption from 500 TWh in 2023 to 4,500 TWh in 2050. That would represent 28 percent of the total growth in generation in the United States, EU, and China by 2050 in IEA STEPS and 49 percent of the growth in IEEJ Advanced Technology. A recent Bipartisan Policy Center study suggests that demand from data centers could account for at most 25 percent of US new electricity generation by 2030. As innovation continues, rapid improvements in hardware and energy efficiency of AI models (as seen with DeepSeek) may occur. Additional factors, such as manufacturing bottlenecks and limitations on AI chips or infrastructure, may also dampen some of the exuberance around generation growth.
Global energy demand grows slowly or declines under all scenarios, as energy efficiency improves and combusted energy sources make up a smaller share of the primary energy mix, which reduces energy conversion losses. In most Reference and Evolving Policies scenarios, global demand rises slowly, plateauing around 600–750 Quadrillion British Thermal Units (QBtu) by 2050. In Ambitious Climate scenarios, primary energy demand declines between 10 percent (IEA NZE) and 33 percent (Equinor Bridges) relative to 2023. As with other trends in this report, energy demand growth differs between high-income nations, where demand typically falls, and low-income nations, where consumption continues to grow.
Figure 4. World Primary Energy Demand and Carbon Intensity (net CO₂ per QBtu)

Notes: Projections ordered from highest to lowest demand for fossil fuels. Historical data from IEA. “Biomass” excludes biofuels, which are included in “Liquids.” “Other” includes wind and solar for IEEJ, Equinor, and OPEC and hydro for BNEF. Carbon intensity is net CO₂ emissions per unit of primary energy demand. CO₂ data are not available for OPEC.
All scenarios project lower coal demand in 2050 compared to 2023, ranging from a decline of 28 percent (IEEJ Reference) to 93 percent (Equinor Bridges), but other fossil fuels offer a more mixed picture. Liquids demand is higher in 2050 under three scenarios, and natural gas demand is higher under five scenarios. As with previous years, wind and solar grow dramatically under all scenarios where data are available. The share of wind and solar in primary energy demand ranges from 12 percent (ExxonMobil) to 41 percent (IEA NZE) in 2050.
In a change from the last several decades, the carbon intensity of energy falls under all scenarios. For Reference and Evolving Policies scenarios, this ranges from 16 percent (IEEJ Reference) to 59 percent (IEEJ Advanced Technologies). Ambitious Climate scenarios project a much more dramatic decline, even reaching negative territory under one scenario (Equinor Bridges).
Global CO₂ emissions have risen by almost 50 percent since 2000, reaching roughly 35 gigatonnes in 2023. However, achieving net-zero emissions targets will require CO₂ emissions to decline dramatically. This year’s scenarios show a wide range of possible outcomes, but Reference and Evolving Policies scenarios indicate that current efforts fall far short of the global goal of limiting temperature rise to “well below 2°C by 2100” as articulated in the 2015 Paris Climate Agreement.
Figure 5. Net CO₂ Emissions

Notes: Historical data from bp.
Global CO₂ emissions are projected to decline under all scenarios except IEEJ Reference, where they remain relatively flat (CO₂ projections are not available from OPEC, but emissions likely grow under its Reference case). Under other Reference and Evolving Policies scenarios, emissions decline from 2023 to 2050, ranging from -24 percent (bp Current Trajectory) to -70 percent (IEA APS). This breadth highlights the gap between existing efforts and the goals articulated by countries in their Nationally Determined Contributions, which are reflected in the IEA APS.
Ambitious Climate scenarios project a much faster rate of decline in emissions, falling by more than 90 percent by 2050. These scenarios accelerate energy efficiency gains, grow renewable technologies, reduce fossil fuel demand, and deploy CCS at scale by 2050. In some of these scenarios, net CO₂ emissions remain slightly above zero by 2050. These pathways reflect an “overshoot” scenario, where some portion of historical emissions are negated by future CO₂ removals using direct air capture, nature-based solutions, or other strategies.
In 2023, a record-breaking 562 gigawatts (GW) of renewable capacity was added worldwide, more than 60 percent higher than in 2022. However, achieving the goal set at COP28 of “tripling renewable energy capacity globally” to 11,000 GW by 2030 will require more than 6,700 GW of additional capacity, or an average of more than 950 GW per year. This raises the question of whether tailwinds from the growth seen in 2023 can be expanded and sustained in the years ahead. In particular, challenges with integrating new capacity in regional grids and with supply chains for some technologies (such as manufacturing bottlenecks in the onshore wind market and fluctuations in the cost of raw materials) could be a barrier to rapid growth. The prospects of a global trade war and reduced policy support for renewables in the United States pose additional headwinds to achieving a tripling of renewables by 2030.
Figure 6. Renewable Electricity Capacity Versus 2030 Target

Notes: Historical data from IEA. “Renewables” includes hydro, biomass, wind, solar, geothermal, and tidal energy. Projections are taken directly for IEA. Projections for other organizations are estimated based on an organization’s renewable electricity generation projections, converted to capacity assuming capacity factors imputed from the IEA APS.
Two Ambitious Climate scenarios (IEA NZE and BNEF NZS) and one Evolving Policies scenario (IEA APS) achieve the 2030 target, and Equinor Bridges falls just below it. Except for APS, these scenarios are not based on existing or announced policies. Nonetheless, most scenarios expect renewable capacity additions to accelerate, with IEA STEPS showing average annual growth of 789 GW. Three Reference scenarios are more bearish, with average annual growth falling below 2023’s level through 2030.
In all scenarios, renewables growth is led by wind and solar, and in all IEA scenarios, solar PV more than triples from 2023 to 2030, accounting for more than 70 percent of renewable capacity growth. In 2023, solar module prices fell and are expected to remain low, thanks to investments in manufacturing capacity in many countries, including China.
Energy security and resilience continue to be key concerns for policymakers, reinforced by geopolitical events, such as Russia’s invasion of Ukraine, conflicts in the Middle East, and an uncertain US security posture. At the same time, there is a surge of new liquified natural gas (LNG) export capacity, driven by new projects in the United States and Qatar that are set to increase export capacity from 578 billion cubic meters (bcm) in 2023 to 850 bcm by 2030. Although this capacity boosts global energy security and the diversity of supply on global energy markets, world demand for LNG declines well below export capacity under Ambitious Climate scenarios. This raises the possibility that either (a) LNG exports may be a headwind undermining global climate goals or (b) these facilities will become “stranded assets” in a net-zero future.
Figure 7. Projected LNG Demand and Export Capacity
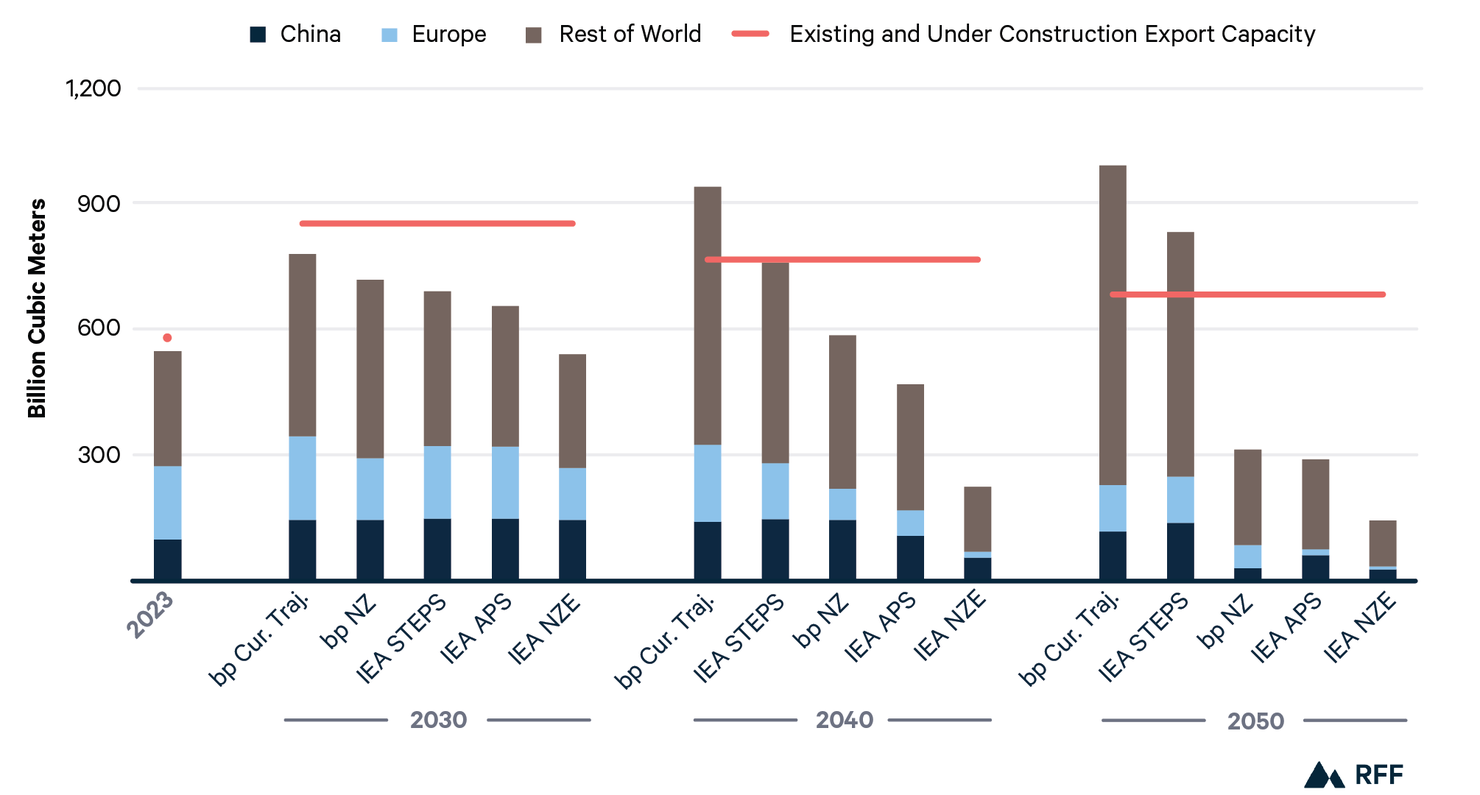
Notes: Historical data from IEA. Export capacity based on IEA estimates. Future export capacity includes only existing and under construction projects. New LNG export capacity primarily comes from the United States and Qatar.
In 2040 and 2050, LNG demand meets or exceeds existing capacity in Evolving Policy and Reference scenarios but falls well short in Ambitious Climate scenarios. Additional LNG facilities are likely to begin construction in the years ahead in the United States, Qatar, and elsewhere, meaning that market oversupply could be even greater by midcentury under Ambitious Climate scenarios. However, some recent projections, such as Shell’s 2025 LNG Outlook (not included in this analysis), are more bullish on future demand.
Key markets, particularly Europe, are already making significant progress in energy transition efforts, reflected by declining LNG demand by 2050 under all scenarios. In China, LNG growth is modest under the most bullish scenarios, suggestion that renewables, rather than natural gas, are likely to lead in displacing domestic coal. Trade disputes sparked by US tariffs include major importers, such as China, which may further raise the costs of trade, diminishing the outlook for US LNG.
Since 2010, natural gas demand has grown almost 30 percent globally, driven primarily by North America, Asia Pacific, and the Middle East. The future of global natural gas varies widely by scenario but has two broad and opposing regional trends. In developing countries, demand rises, driven by industrialization and economic growth. In developed ones, demand is flat or declining due to electrification of end uses, other investments in the energy transition, and—in Europe—a potentially declining industrial base.
Figure 8. Change in Natural Gas Demand

Notes: Historical data from IEA.
From 2010 to 2023, natural gas demand in Europe and Eurasia fell by 8 percent. In most scenarios, this trend continues through 2035, and it is consistent across every scenario by 2050, ranging from -3 percent (bp Current Trajectory) to -74 percent (bp NZE) relative to 2023. In North America, demand grows or declines moderately through 2035 in Reference and Evolving Policies scenarios, and Ambitious Climate scenarios project a substantial decline. All scenarios but one (IEEJ Reference) project demand to fall by 2050, ranging -7 percent (ExxonMobil) to -49 percent (IEA APS) relative to 2023 levels.
In Asia Pacific, all scenarios except IEA APS project increased demand through 2035. Although this growth continues through 2050 for most Reference and Evolving Policies scenarios, IEA APS and bp NZE project a sharp decline, reflecting higher levels of climate ambition. Africa and the Middle East both see growth in demand through 2035 and 2050 in Reference and Evolving Policies scenarios, and Ambitious Climate scenarios again project a slowdown or decline by 2050.
Under most scenarios, global oil demand is lower by 2050 than it is today. Three Reference scenarios (ExxonMobil, IEEJ, and OPEC) show oil consumption growing slowly or plateauing by 2025, but all other scenarios project a peak and decline of oil consumption by 2030. However, 2050 has a wide range of projected demand, spanning 98 mb/d. Under Ambitious Climate scenarios, oil demand falls to roughly 25 mb/d by 2050.
Figure 9. World Oil Demand

Notes: Historical data from IEA. Where outlooks do not provide projections in physical units (mb/d), we convert to mb/d using a factor of 1.832 QBtu per mb/d.
Today and in all projections, oil consumption is concentrated in the industrial and transportation sectors. Across most Reference and Evolving Policy scenarios, oil consumption in transportation peaks by 2030, primarily due to vehicle efficiency improvements and continued electrification in the light duty fleet. In the industrial sector, oil demand grows or remains flat in Reference and Evolving Policy scenarios, with growth concentrated in emerging economies.
In North America, oil demand has remained relatively flat and declines across scenarios by 2030. Similarly, demand peaks before 2030 under all scenarios in Europe and Eurasia. In China, demand peaks by 2030 under all scenarios other than OPEC Reference. In India and Africa, however, oil demand grows under all Reference and Evolving Policies scenarios but declines in Ambitious Climate scenarios for both regions.
Hydrogen is poised to play a larger role in the energy system and may be particularly valuable in “hard-to-abate” sectors, such as industry and heavy-duty transportation. Hydrogen is used today in oil refining and chemicals production, primarily sourced from natural gas through steam methane reforming (SMR). In Ambitious Climate scenarios, hydrogen plays a substantial role in the energy sector, sourced largely from electrolysis powered by renewables (“green hydrogen”) and SMR with CCS (“blue hydrogen”).
Figure 10. Global Share of Hydrogen in Final Energy Consumption

Notes: Calculated as final energy consumption from hydrogen divided by total final energy consumption.
Unsurprisingly, hydrogen grows fastest under Ambitious Climate scenarios, rising to account for 4–7 percent of global final energy consumption by 2050. In Reference and Evolving Policies scenarios, hydrogen plays a larger role than in today’s energy system but remains below 1 percent of final energy consumption under most scenarios. A key headwind to the future of low-emissions hydrogen is the uncertainty around policy support. In the US, the Inflation Reduction Act included a tax credit of up to $3 per kilogram of clean hydrogen and funding to develop hydrogen “hubs.” However, the outcome of the 2024 federal election has created deep uncertainty over the durability of these policies.
Only the IEA provides public data on the contribution of different technologies to the hydrogen mix. In STEPS, green hydrogen comprises roughly a quarter of global production in 2050 and blue hydrogen comprises 16 percent, meaning that low-emissions hydrogen comprises less than half of the global total. Low-emissions production grows much more rapidly in APS, with green and blue hydrogen comprising 64 and 23 percent of the mix, respectively. In NZE, almost 80 percent of hydrogen produced in 2050 is green while almost all of the remainder is blue.
3. In Focus
3.1. Different Regions, Different Renewables Shares
Renewables, led by solar and wind, have come to play a significant role in the global energy mix, and this growth continues under all scenarios through 2050. Breaking down that growth by region reveals different distributions by resource type. Regions have different climates, natural resource endowments, and policies that shape their historical and projected shares of renewable demand. We compare the distribution of solar, wind, and geothermal energy demand from 2010 to 2050 between IEA, bp, and IEEJ, the three projections that provide sufficient data for such analysis.
3.1.1. Solar
In China, solar’s growth has been rapid in recent years, with capacity increasing by 45 percent in 2024 alone. China’s solar consumption leads the world, more than twice that of the US level in 2023. China continues to lead in 2050, accounting for 16 percent of global solar energy demand in the most cautious scenario (bp Current Trajectory) and 45 percent in the most confident (IEA APS). China is also a leading exporter of solar technology, particularly to Europe and other Asian nations, a trend that is likely to continue if China continues to be the world’s lowest-cost supplier.
In India, solar demand also grows strongly, rising from roughly 0.4 QBtu in 2023 to 1.1–1.9 QBtu by 2030, then accelerating strongly to 2050, with 6–8 QBtu under Evolving Policies scenarios and 12–14 QBtu under Ambitious Climate scenarios. However, India continues to lag China and the United States in total solar demand across all scenarios. Taken together, the global “East” commands solar energy demand across all scenarios by 2050. However, its share declines from 70 percent in 2023 to 58–69 percent by 2050 across scenarios from bp (Net Zero) and IEA (STEPS).
The expected growth in solar from now until 2030 is marked across multiple geographies. In the IEA scenarios, US solar demand 2023–2030 is expected to quadruple under STEPS and quintuple under APS. In China, solar demand quintuples under both IEA scenarios. These ambitious growth projections are contextualized by the suddenly contrasting policy outlooks for the energy transition in both countries. Although China continues a booming solar build-out, the United States has recently taken steps to off-ramp federal support of renewables deployment.
Figure 11. Solar Primary Energy Demand by Region

Notes: Historical data from IEA.
3.1.2. Wind
Unlike solar, wind energy demand has historically been led by the global “West,” which accounted for more than 75 percent of global wind demand in 2010. However, other nations in the East, and China in particular, have increasingly deployed wind energy. By 2023, the global East had grown to account for 47 percent of the world’s wind energy consumption, and China was the world leader at the country-level. This trend is posed to continue, as China increased its wind capacity by 18 percent in 2024.
Looking forward, China’s wind sector continues to grow strongly, although its share of global demand falls as other nations grow even faster. Under the scenarios that provide sufficient data, by 2050, China’s wind demand grows from 3 QBtu in 2023 to 12–19 QBtu, with its share of global demand falling from 38 percent to 9–23 percent. India’s wind sector also grows strongly over the projection period, rising from 0.3 QBtu in 2023 to 3–9 QBtu by 2050. India’s share of global wind demand rises from 4 percent in 2023 to 5–10 percent by 2050 across the scenarios.
In the West, Europe has driven the growth of wind energy, with 20 percent of its electricity generated by wind in 2024. Under the scenarios examined, Europe continues to lead the West in wind; by 2050, it accounts for 47–71 percent of demand and consumes similar levels as China, the world leader. However, several factors are generating headwinds to growth in the West, including high capital costs, difficulty in siting and permitting, and reductions in policy support. Reflecting these challenges, some major wind firms have announced investment cuts in recent months.
Figure 12. Wind Primary Energy Demand by Region

Notes: Historical data from IEA.
3.1.3. Geothermal
As electricity demand rises rapidly, new innovations are enabling energy sources with previously limited applications. For instance, conventional geothermal power has existed for decades but was limited to a handful of regions with high levels of heat at relatively shallow depths and permeable rock. However, new technologies adapted from the oil and gas industry, including horizontal drilling and multistage hydraulic fracturing, have greatly expanded opportunities. Most outlooks that provide geothermal-specific data project strong growth to 2050.
Figure 13. World Geothermal Demand

Notes: Historical data from IEA.
In recent decades, geothermal has grown slowly, rising at 2.4 percent CAAGR from 2010 to 2023, reaching 3.3 QBtu. However, most outlooks project significantly higher growth to 2050, with the more bullish scenarios ranging from 4.6 percent (IEEJ Reference) to 7.7 percent (IEA NZE) CAAGR. This reflects significant cost declines that are projected to continue, making projects competitive with other dispatchable or “baseload” power sources. Although geothermal grows strongly across most scenarios, it remains a relatively small portion of overall primary energy demand, rising to 5 percent of global primary energy demand by 2050 under the most bullish scenario (IEA NZE).
Unlike wind and solar, China, Europe, and India have made small contributions to geothermal production historically. Instead, the world’s leading geothermal producers are Indonesia, the United States, and the Philippines, which benefit from suitable geologies that have enabled the deployment of conventional systems. IEEJ, the only outlook that publishes country-level data on geothermal, projects that Indonesia’s demand will shoot up with a CAAGR of more than 5 percent through 2050, ultimately reaching 5–7 QBtu by 2050. IEEJ projects relatively slow growth in other regions, including the United States, which suggests that it is not accounting for recent innovations in advanced geothermal development.
In a 2024 report focused specifically on geothermal, IEA describes the vast potential for advanced technologies to be deployed globally. Because of the technological innovations described earlier in this section, geothermal may now be developed cost-effectively worldwide, rather than focusing on the relatively few regions with exceptionally shallow resources (e.g., Indonesia). As these technologies develop, projections for geothermal’s role may become much more substantial.
3.2. Evolving Expectations for Africa’s Energy Mix
Africa has seen the fastest population growth of any continent in recent decades, recently growing to more than 1.5 billion people. Projections in this year’s Global Energy Outlook estimate that it will exceed 2 billion people by 2040, far outpacing growth in all other regions. Unsurprisingly, energy demand is projected to increase alongside the continent’s population and economy. However, expectations about the pace of energy demand growth have slowed considerably in recent years. Compared with projections from 2018, future demand for coal, oil, and—for most projections—natural gas, have each declined while renewables have grown.
Figure 14. Projections for Africa Primary Energy Demand from 2018 and 2024

Notes: Biomass excluded for bp and EIA. For EIA, “oil” includes nonpetroleum liquids (i.e., biofuels). EIA did not publish an International Energy Outlook in 2018 or 2024, so we use 2019 and 2023 instead. IEA NPS refers to the New Policies Scenario, an Evolving Policies scenario similar in design to 2024’s STEPS scenario. Both IEEJ scenarios refer to the IEEJ Reference scenario.
These lower expectations for energy demand growth reflect reduced expectations for the energy intensity of the continent’s economy. GDP growth is stronger in recent projections relative to those made in 2018, and population growth expectations are broadly similar. As a result, energy use per unit of economic output in 2040 is 25–30 percent lower in 2024’s projections relative to 2018’s, and per capita energy use is roughly 20 percent lower.
3.2.1. Energy Poverty
Do these lower levels of per capita energy consumption suggest that efforts to alleviate energy poverty in Africa are failing to gain traction? According to recent data from the IEA, more than 600 million people in Africa lack access to electricity, and roughly 1 billion lack clean cooking equipment. Although electricity consumption per capita grew by 18 percent from 2000 to 2022, it remained 82 percent below the global average in that year. On average, Africans consumed just 0.6 MWh per person in 2022, ranging from 0.015 MWh in Chad to 3.5–4 MWh in South Africa and Libya. For reference, a standard refrigerator/freezer combo in the United States uses 0.3–0.8 MWh annually.
After several years of little improvement after the pandemic and inflation-induced challenges, the IEA STEPS scenario projects that electrification will accelerate to cover 70 percent of the continent’s population by 2030, up from 59 percent today. It also projects that the number of people lacking access to clean cooking technologies will plateau by 2030. These developments, although far from the United Nations Sustainable Development Goal #7 (universal access to affordable, reliable, sustainable, and modern energy), do offer some hope for further progress. However, substantial additional investment from inside and outside of Africa is clearly needed to improve access to modern energy services.
3.2.2. Coal and Electricity
Reflecting global trends, expectations for coal consumption in Africa have declined dramatically over roughly the last 10 years. Reference and Evolving Policies projections from 2015 envisioned rapid coal demand growth through 2040, whereas projections from 2024 show a slow decline, falling by 20–40 percent under scenarios from IEA, bp, and ExxonMobil (Figure 15).
Figure 15. Projections for Africa Coal Demand, 2015 and 2024

Notes: IEA projections are New Policies (2015) and STEPS (2024) scenarios; bp projections are Reference (2015) and Current Trajectory (2024) scenarios. Both ExxonMobil projections are Reference scenarios.
This decline reflects, in large part, South Africa’s recent efforts to transition away from coal, with the support of international finance through the Just Energy Transition Partnership. From 2000 through 2014, South Africa consumed more than 90 percent of all coal used for power generation on the continent, but this share has fallen to 84 percent as of 2022. Similarly, the share of coal in South Africa’s power mix has declined from more than 90 percent in the early 2010s to 84 percent as of 2022. In its place, wind and solar have grown to account for 7 percent of generation, along with oil, which is used as a “peaking” fuel, providing 2 percent of South Africa’s electricity in 2022.
Outside of South Africa, natural gas consumption in the power sector has grown dramatically in recent years, becoming the continent’s largest overall power source in 2012 and, by 2022, accounting for 47 percent of its electricity mix. Looking forward, projections for natural gas demand vary widely. The most bullish projections come from IEEJ, which projects power sector gas demand to more than triple by 2050 under both of its scenarios. More modest growth comes in IEA STEPS (+75 percent) and Equinor Walls (+26 percent); while gas-fired generation declines by 33 under IEA APS and nearly 70 percent under Equinor Bridges.
Renewable electricity generation grows rapidly under all scenarios that provide comparable data. Compared to 2023, solar generation across Africa increases roughly 30-fold under Evolving Policies scenarios by 2050 and nearly 100-fold under Ambitious Climate scenarios from Equinor and IEA. Wind also grows impressively, rising 12- to 15-fold under Evolving Policies scenarios and as much as 60-fold under Ambitious Climate scenarios over the same period. Together, solar and wind grow from 5 percent of electricity generation in 2023 to 39 percent by 2050 at the low end (IEA STEPS) and up to 75 percent at the high end (Equinor Bridges). Figure 16 illustrates power sector projections from the IEA and Equinor, the two outlooks that publish sufficient data.
Figure 16. Electricity Generation in Africa

Notes: Energy sources in the “other” category are not specified but likely include large proportions of hydropower and contributions from geothermal and biomass.
Per capita electricity consumption in 2050 ranges widely but remains well below global averages across the scenarios that provide sufficient data. Under IEA STEPS, IEEJ Reference, and Equinor Walls, per capita electricity consumption in Africa averages 1.1–1.3 MWh per person, and ranges from 1.7–2.2 MWh per person under IEA APS, IEEJ Advanced Technologies, and Equinor Bridges. Globally, per capita electricity consumption in 2050 ranges from a low of 4.8 MWh (ExxonMobil Reference) to a high of 8.3 MWh per capita (IEA NZE). In 2023, average US per capita consumption was 11.6 MWh.
3.2.3. Oil and Natural Gas
Projected demand for oil in Africa has also declined substantially relative to outlooks from roughly 10 years ago. As shown in Figure 17, projections in 2024 from bp and ExxonMobil are considerably lower than those made under similar scenarios in 2015. From 2000 to 2015, the CAAGR for oil demand was 3 percent across the continent. Had this growth rate continued, oil demand would have exceeded 15 QBtu by 2040, roughly in line with ExxonMobil’s projection from 2015 (projections from bp and IEA were less bullish). However, oil demand growth stagnated in subsequent years, declining substantially in 2020 due to the COVID-19 pandemic but then rebounded, rising by roughly 5 percent annually in 2021, 2022, and 2023.
Figure 17. Projections for Africa Oil Demand, 2015 and 2024

Notes: IEA projections are New Policies (2015) and STEPS (2024); bp projections are Reference (2015) and Current Trajectory (2024) Both ExxonMobil projections are Reference scenarios. bp’s 2015 projection is “liquids” rather than “oil.” Liquids include non-petroleum liquid fuels (e.g., liquid biofuels), which are a very small portion of Africa’s current or projected demand for liquid fuels under these scenarios.
For natural gas, this year’s projections are mostly barely distinguishable from those made under similar scenarios in 2015. IEA, bp, and ExxonMobil all project roughly a doubling of demand by 2050 (ExxonMobil’s historical data and projections are higher than bp and IEA because it includes flared natural gas with associated oil production, which bp and IEA do not).
Figure 18. Projections for Africa Natural Gas Demand, 2015 and 2024

Notes: IEA projections are New Policies (2015) and STEPS (2024); bp projections are Reference (2015) and Current Trajectory (2024) scenarios. ExxonMobil projections are Reference scenarios. ExxonMobil includes flared natural gas.
However, this demand growth is not consistent with Ambitious Climate scenarios, under which natural gas consumption declines substantially by 2050 globally and in Africa. For example, bp’s Net-Zero shows African gas demand falling to roughly 2.2 Qbtu by 2050, and Equinor’s Bridges falls to 2.5 Qbtu. This represents a decline of more than half from 2023’s levels (6 QBtu).
3.3. China’s Decarbonization Outlook
Since surpassing the United States in 2006, China has been the largest contributing country to annual CO₂ emissions globally, meaning its emissions trajectory is a key factor in future climate change. In 2020, President Xi Jinping announced China’s dual goals of “aim[ing] to have CO₂ emissions peak before 2030 and achieve carbon neutrality before 2060”—sometimes referred to as the “3060” dual carbon goals. In this section, we focus on the projections for China’s CO₂ emissions and energy use by fuel—both for primary energy and in the electricity sector specifically.
Figure 19 shows projected CO₂ (or CO₂-equivalent) emissions from China through 2050. Most of the projections anticipate China hitting peak emissions before the 2030 target, with only ExxonMobil projecting a peak in 2030. This suggests some optimism regarding the “30” component of the dual “3060” goals. The projections typically end in 2050, making it somewhat difficult to judge the likelihood of the “2060” component of “3060.” Nonetheless, a simple (albeit potentially naïve) extrapolation of the trends through 2050 suggests that most of the scenarios are not on track for net-zero emissions by 2060. Only the Ambitious Climate scenarios from bp and Equinor effectively reach zero by 2050. Yet all scenarios imply substantial emissions reductions compared to today.
Figure 19. CO₂ Emissions in China

Notes: Emissions metrics differ across sources in gross versus net and CO₂ equivalent (CO₂e) versus CO₂. Equinor values are gross CO₂; ExxonMobil, IEA, and IEEJ values are net CO₂; bp values are net CO₂e.
Figure 20 shows the changing primary energy mix underlying these projected reductions in Chinese emissions. Most scenarios show relatively flat or rising total primary energy use, even rising through 2030 despite falling emissions. The deceleration in energy use relative to past trends owes in part to a combination of a shrinking population and slowing GDP growth rates (typically in the 2–4 percent range). Across the board, the diverging trends in emissions (declining) relative to energy use (flat or rising) owe to a rising share of nonhydro renewable energy replacing coal, and the contributions of other fuels vary across scenarios. In Reference and Evolving Policies scenarios (left column of Figure 20), oil and gas consumption remains relatively constant but falls under scenarios with stronger climate action (right column). The most notable example is Equinor, which envisions oil’s contribution to primary energy falling from 20 percent in 2020 to 18 percent in 2050 under Walls but to just 9 percent under Bridges. The nonhydro renewable share, driven by wind and solar, rises from 9 percent in 2020 to 36 percent in Walls but 67 percent in Bridges.
Figure 20. Primary Energy Consumption in China, by Fuel

Notes: “Other” is the difference between the reported total and all other categories and only relevant for IEA.
Because a major transformation of the energy system in China would likely require a significant electrification of the economy, Figure 21 dives into the projected electricity generation by fuel, including a disaggregation of nonhydro renewables into the three main components: wind, solar, and biomass. Biomass is generally projected to play a minor role. Although IEEJ and Equinor project relatively equal contributions of wind and solar, IEA projects major increases in solar in both STEPS and APS. Despite these increases in renewable generation, coal only effectively disappears from the power sector under the Ambitious Climate scenarios. Under the less ambitious scenarios, it falls from 60 percent of the power mix to 9, 10, and 20 percent of the total in IEA STEPS, Equinor Walls, and IEEJ Reference scenarios, respectively. Although nuclear is usually expected to grow in substantially in absolute terms—rising from about 400 TWh today to 900 TWh or more in 2050 in all six scenarios—it nonetheless remains a relatively small player in the overall generation mix.
Figure 21. Electricity Generation in China, by Fuel

Notes: Other is computed as the difference between the reported total and all other categories.
4. Data and Methods
In this paper, we examined projections from the following publications:
- BNEF: New Energy Outlook 2024
- bp: Energy Outlook 2024
- Equinor: Energy Perspectives 2024
- ExxonMobil: 2024 Outlook for Energy
- IEA: World Energy Outlook 2024
- IEEJ: Energy Outlook 2024
- OPEC: World Oil Outlook 2024
These outlooks vary across a variety of dimensions, including modeling techniques, historical data, economic growth assumptions, and policy scenarios. Generally, scenarios can be grouped into three categories: (1) Reference, which assume no major policy changes; (2) Evolving Policies, which incorporate the modeling team’s expectations of policy trends; and (3) alternatives, which are typically based on certain policy targets or technology assumptions. We focus on Ambitious Climate scenarios, a major subset of (3). Table 3 summarizes the scenarios included in this year’s analysis.
Table 3. Sources and Scenarios

4.1. Harmonization
Variations in underlying assumptions about the future of policies, technologies, and markets produce useful variation among outlooks, allowing analysts to view a wide range of potential energy futures. However, outlooks also have important methodological differences, which can complicate direct comparisons and reduce the ability to draw insights.
One major difference is the choice of reporting units. For primary energy, outlooks use different energy units, such as QBtu, million tonnes of oil equivalent (mtoe), or exajoules (EJ). In this report, we standardize all units to QBtu. For fuel-specific data, outlooks also vary, using million barrels per day (mbd) or million barrels of oil equivalent per day (mboed) for liquid fuels, billion cubic meters (bcm) or trillion cubic feet (tcf) for natural gas, million tonnes of coal-equivalent (mtce) or million short tons (mst) for coal, and Terawatt hours (TWh) or Gigawatt hours (GWh) for electricity generation. Table 4 presents the reporting units for each outlook, and Table 5 provides relevant conversion factors.
Table 4. Units of Energy Consumption, by Outlook

Notes: Units are per year unless the unit abbreviation indicates otherwise. N/A indicates that fuel-specific data are not available for a given source.
Table 5. Conversion Factors for Key Energy Units

Notes: There is no agreed-upon factor for boe. IEA reports that typical factors range from 7.15 to 7.40 boe per toe, and OPEC uses a conversion factor of 7.33 boe per toe. We derive 1.976 QBtu/mboed by multiplying 49.8 mtoe/mboed (=1 toe / 7.33 boe * 365 days per year) by 0.03968 QBtu/mtoe.
A second key difference among outlooks is that assumptions about the energy content in a given physical unit of fuel result in different conversion factors for data presented in energy units (e.g., QBtu) versus physical units (e.g., mbd or bcm). Among the outlooks we examine, these assumptions vary by up to 10 percent. Although conversion unit variations may appear small, they are amplified when applied across the massive scale of global energy systems, particularly over a long time horizon.
A third major difference results from varying decisions about including nonmarketed biomass, such as locally gathered wood and dung, in historical data and projections for primary energy consumption. In previous years, bp and the EIA had not included these sources in their projections. However, bp’s Energy Outlook 2024 does include nonmarketed biomass, allowing for enhanced comparability.
Yet another difference relates to comparing the energy content of fossil and nonfossil fuels. The primary energy content of oil, natural gas, and coal is relatively well understood and similar across outlooks. However, a substantial portion of that embodied energy is wasted as heat during combustion. Because nonfossil fuels, such as hydroelectricity, wind, and solar, do not generate substantial waste heat, identifying a comparable metric for primary energy is difficult, and outlooks take a variety of approaches.
Other differences in outlooks include (1) different categorizations for liquid fuels and renewable energy, (2) different regional groupings for aggregated data and projections, (3) net versus gross calorific values when reporting energy content of fossil fuels, (4) net versus gross generation when reporting electricity data, and (5) whether and how flared natural gas is included in energy consumption data.
To address those challenges and allow for a more accurate comparison across outlooks, Newell and Iler use a harmonization process, which we update and apply here. In previous years, we have included a methodology report (see Raimi and Newell). This year’s report follows the same process outlined in that report but with updated numbers. For any specific questions about our methods, please contact Yuqi Zhu ([email protected]).
5. Statistics
Table 6. Global Key Indicators

Notes: Historical data from IEA. Net CO₂ emissions include positive (gross) and negative emissions from sources such as direct air capture and bioenergy with CCS. CO₂ emissions data include fossil fuel combustion and exclude industrial process emissions.
Table 7. World Primary Energy Consumption

Notes: “Liquids” only includes oil for BNEF and Equinor, as biofuels-specific data were not available. “Other renewables” includes hydro for BNEF, which does not provide hydro data.
Table 8. Liquids Consumption, by Region

Notes: Historical data from bp Statistical Review of World Energy. “Liquids” only includes oil for BNEF and Equinor, as biofuels data were not available. Regional totals may not sum because of different treatment of international aviation and bunker fuels and, for IEA, excluding biofuels in regional data. Where volumetric data are not published, we assume a conversion factor of 1.832 QBtu per mbd, or 0.54585 mbd per QBtu.
Table 9. Natural Gas Consumption, by Region

Notes: Historical data from bp Statistical Review of World Energy. Where volumetric data are not available, we assume a conversion factor of 0.923 TCF per QBtu.
Table 10. Coal Consumption, by Region

Notes: Historical data from bp Statistical Review of World Energy.
Table 11. Nuclear Consumption, by Region

Notes: Historical data from bp Statistical Review of World Energy.
Table 12. Global Electricity Generation by Source

Notes: Historical data from IEA. OPEC does not publish electricity data. Equinor excludes electricity used in electrolysis to produce hydrogen.
Table 13. Global Renewable Electricity Generation by Source

Notes: Historical data from IEA. OPEC does not present electricity generation data. Equinor and ExxonMobil include geothermal in “other.” Biomass/waste also includes biogas.
Table 14. Net Carbon Dioxide Emissions, by Region

Notes: Historical data from bp Statistical Review of World Energy. Net CO₂ emissions include positive (gross) and negative emissions from sources such as direct air capture and bioenergy with CCS. CO₂ emissions data include fossil fuel combustion and exclude industrial process emissions. Regional data from bp and IEA are excluded because they include methane emissions (bp), flaring (bp), and industrial process emissions (bp and IEA). Equinor Bridges emissions are negative in 2050, making it impossible to calculate a compound average annual growth rate.
Endnotes
- Grubler, A. 2008. Energy Transitions. In Encyclopedia of Earth. Environmental Information Coalition, National Council for Science and the Environment, Washington, D.C.
- IEA (International Energy Agency). 2022. World Energy Balances Database.
- BNEF. 2024. New Energy Outlook 2024. https://about.bnef.com/new-energy-outlook/
- bp. 2024. Energy Outlook 2024. https://www.bp.com/content/dam/bp/business-sites/en/global/corporate/pdfs/energy-economics/energy-outlook/bp-energy-outlook-2024.pdf
- Equinor. 2024. Energy Perspectives 2024: Global Macroeconomic and Energy Market Outlook. https://www.equinor.com/sustainability/energy-perspectives#downloads
- ExxonMobil. 2024. 2024 Outlook for Energy. https://corporate.exxonmobil.com/sustainability-and-reports/global-outlook
- IEA. 2024. World Energy Outlook 2024. https://www.iea.org/reports/world-energy-outlook-2024
- Institute of Energy Economics, Japan. 2024. Outlook 2025: How to Address the Uncertainties Surrounding the Energy Transition. https://eneken.ieej.or.jp/en/whatsnew/448.html
- OPEC. 2024. World Oil Outlook 2024. https://woo.opec.org/ (2024).
- IEA. 2024. World Energy Investment 2024. https://www.iea.org/reports/world-energy-investment-2024/overview-and-key-findings
- Wood Mackenzie. 2024. Energy Transition Outlook 2024. https://www.woodmac.com/market-insights/topics/energy-transition-outlook/
- Koomey, J., Z. Schmidt, and T. Das. 2025. Electricity Demand Growth and Data Centers: A Guide for the Perplexed. https://bipartisanpolicy.org/download/?file=/wp-content/uploads/2025/02/BPC-Report-Electricity-Demand-Growth-and-Data-Centers-A-Guide-for-the-Perplexed.pdf
- Quigley, J. 2025. Load Growth Irrational Exuberance Crashes into DeepSeek. https://kleinmanenergy.upenn.edu/commentary/blog/load-growth-irrational-exuberance-crashes-into-deepseek/
- Global Wind Energy Council. 2024. Global Wind Report 2024. https://www.gwec.net/reports/globalwindreport#Download2024
- Shell. 2025. Shell LNG Outlook 2025. https://www.shell.com/what-we-do/oil-and-natural-gas/liquefied-natural-gas-lng/lng-outlook-2025.html
- Reynolds, S., Doleman , and G. Peh. 2024. LNG Is Not Displacing Coal in China’s Power Mix. https://ieefa.org/resources/lng-not-displacing-coal-chinas-power-mix
- Corbeau, A.-S., and E. Downs. 2025. What China’s Retaliatory Tariff Means for US–China LNG Trade. https://www.energypolicy.columbia.edu/what-chinas-retaliatory-tariff-means-for-us-china-lng-trade/
- Lewis, M. 2025. China Installed a Record Capacity of Solar and Wind in 2024—in Numbers. Electrek. https://electrek.co/2025/01/21/china-solar-wind-2024/
- Maguire, G. 2024. China Discounts Its Way to Record Solar Module Exports. Reuters. https://www.reuters.com/markets/commodities/china-discounts-its-way-record-solar-module-exports-2024-08-01/
- White, E. 2024. China’s Emissions Peak in Sight as Solar and Electric Cars Boom. The Financial Times. https://www.ft.com/content/4d4f2770-3c95-4390-b4fc-896c92505672
- Chu, A., and J. Smyth. 2025. Donald Trump Wiped Out Dozens of Joe Biden’s Climate Initiatives in First-Week Blitz. The Financial Times (2025). https://www.ft.com/content/c76943c6-38e5-46e7-9a8b-58ab638ed04f
- Lewis, M. 2025. Europe’s Wind Power Hits 20%, But 3 Challenges Stall Process. Electrek. https://electrek.co/2025/01/10/europe-wind-power-hits-20-but-3-challenges-stall-progress/
- Millard, R. 2025. World’s Biggest Offshore Wind Developer Ørsted Slashes Investment by 25%. The Financial Times. https://www.ft.com/content/d5a56e8d-e64b-4190-8a85-ba980ae16ed7
- IEA. 2024. The Future of Geothermal Energy. https://iea.blob.core.windows.net/assets/6f449aa9-9f24-4305-b971-0eef78497beb/TheFutureofGeothermal.pdf
- OECD. 2025. Government Support in the Solar and Wind Value Chains. https://doi.org/10.1787/d82881fd-en
- Moore, M., and T. Wilson. 2025. BP Pivots Back to Oil and Gas After “Misplaced” Faith in Green Energy. The Financial Times.
- Sinha, S., and M. Getachew. 2024. As Africa’s Population Crosses 1.5 Billion, The Demographic Window Is Opening; Getting The Dividend Requires More Time And Stronger Effort | United Nations Economic Commission for Africa. https://www.uneca.org/stories/%28blog%29-as-africa%E2%80%99s-population-crosses-1.5-billion%2C-the-demographic-window-is-opening-getting
- IEA. 2025. IEA Africa. https://www.iea.org/regions/africa
- Dutta, D. 2023. How Much Electricity Does a Fridge, Dishwasher, and an Electric Car Use? We Did the Math. https://blog.se.com/sustainability/2023/01/24/how-much-electricity-does-a-refrigerator-dishwasher-and-an-electric-car-use-we-did-the-math/
- Strambo, C., M. Patel, and S. Maimele. 2024. Implementing Just Transitions: Takeaways from South Africa. https://www.sei.org/publications/just-transitions-south-africa/
- IEA. South Africa. 2025. IEA. https://www.iea.org/countries/south-africa/electricity
- EIA. 2024. Electric Power Monthly—Table 5.1. https://www.eia.gov/electricity/monthly/epm_table_grapher.php
- Newell, R.G., and S. Iler. 2013. The Global Energy Outlook. https://doi.org/10.3386/w18967
- Raimi, D., and R.G. Newell. 2023. Global Energy Outlook Comparison Methods: 2023 Update. www.rff.org/geo


