Global Energy Outlook 2022: Turning Points and Tension in the Energy Transition
RFF’s annual Global Energy Outlook report examines a range of projections for the global energy system, summarizing key implications for global energy consumption, emissions, and geopolitics.
The global energy system faces deep uncertainty in the near, medium, and long terms. Amidst war in Europe, the urgent need to reduce greenhouse gas emissions, and many other factors, long-term energy outlooks offer one lens through which to assess the wide range of potential futures for global energy, emissions, and even geopolitics.
Because these projections vary widely and depend on varying underlying assumptions and methodologies, they are difficult to compare on an apples-to-apples basis. In this report, we apply a detailed harmonization process to compare 19 scenarios across seven energy outlooks published in 2021. Taken together, these scenarios offer a broad scope of potential changes to the energy system as envisioned by some of its most knowledgeable organizations. Table 1 shows the historical datasets, outlooks, and scenarios examined here.
Table 1. Outlooks and Scenarios Examined in This Report

A brief description of our methodology is provided under Data and Methods (Section 4), with select data indicators under Statistics (Section 5). For the full methodology, see Raimi and Newell,10 and for the dataset and interactive graphing tools, visit www.rff.org/geo.
Throughout the figures included in this report, we use a consistent labeling system that distinguishes among the different scenarios (see Table 2):
- For “Reference” scenarios, which assume limited or no new policies, and for scenarios that assume continued geopolitical challenges, we use a long-dashed line: this set comprises IRENA PES, Equinor Rivalry, Shell Islands, OPEC Reference, and US EIA Reference case.
- For “Evolving Policies” scenarios, which assume that policies and technologies develop according to recent trends and/or the expert views of the team producing the outlook, we use solid lines: this set comprises Equinor Reform, IEA STEPS, and Shell Waves.i For IEA APS, which assumes governments implement all announced energy and climate policies, we use a dot-dash format.
- For “Ambitious Climate” scenarios, which are built around limiting global mean temperature rise below 2°C by 2100, we use short-dashed lines: this set comprises BNEF Green, Gray, and Red scenarios; Equinor Rebalance; and IEA SDS.
- Finally, we include an additional set of Ambitious Climate scenarios designed to limit global mean temperature rise to 1.5°C by 2100, which we illustrate with a dotted line: IEA NZE, IRENA 1.5C, and Shell Sky1.5.
Table 2. Legend for Different Scenario Types

Related
2. Key Findings
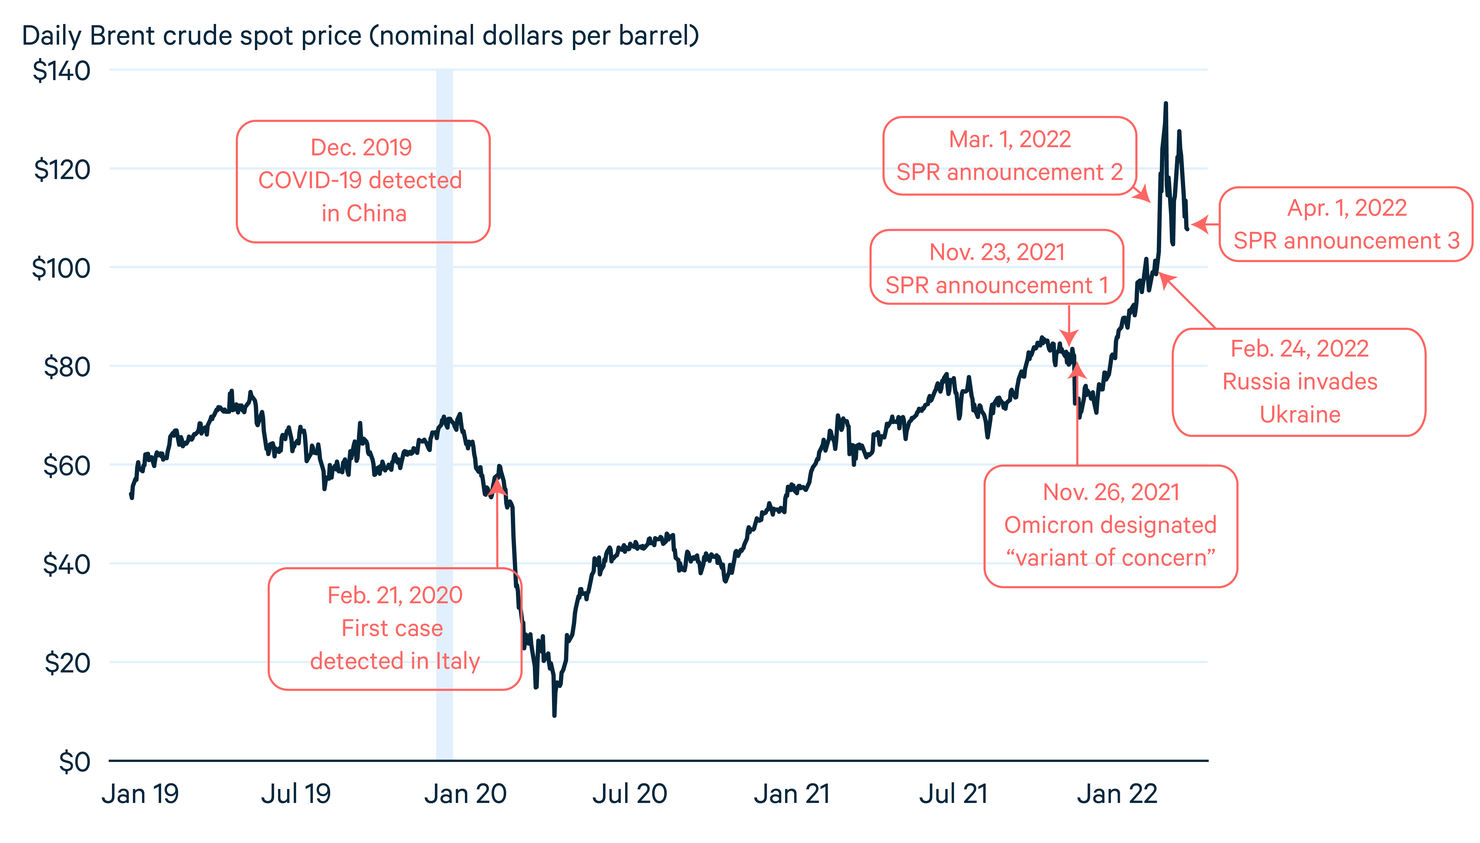
Global energy markets are under stress. Even before Russia’s invasion of Ukraine, Brent crude spot prices rose from an average of $42/bbl in 2020 to $71/bbl in 2021. By early March 2022, as Russian tanks rolled across the border, Brent prices spiked to more than $120/bbl. Energy outlooks released in 2021 could not have anticipated these events, and only one scenario (the US EIA’s High Oil Price) assumed oil prices reaching today’s levels at any point before 2050.
Figure 1. Brent Crude Oil Price History and Projections

European natural gas markets have experienced even greater price spikes. Dutch natural gas prices, which had already reached record levels in 2021, surged to more than €165 per megawatt-hour (roughly $54 per MMBtu) in early March, more than 10 times higher than the 2020 average. These price increases burden energy consumers around the world. In the near term, options for easing high prices are limited, but in the medium to longer terms, energy security can be enhanced through reducing oil and natural gas consumption and further diversification of suppliers.
Many options to enhance energy security also align with long-term climate goals. For example, energy efficiency and accelerating the electrification of transportation, heating, and other uses can reduce exposure to volatile hydrocarbon prices. Still, clean energy technologies such as electric vehicles, wind turbines, and solar modules also rely on global supply chains which in some cases are geographically concentrated and inelastic, indicating that geopolitics will continue to play a role in energy markets for the foreseeable future.
Under all Reference and Evolving Policies scenarios, global primary energy consumption grows considerably over the next three decades, but CO2 emissions rise under only half of these scenarios, implying a less carbon-intensive energy mix. Under most Ambitious Climate scenarios, dramatic improvements in energy efficiency lead aggregate primary energy consumption to decline as emissions plummet due to a much cleaner fuel mix.
Figure 2. Global Primary Energy Mix and Carbon Dioxide Emissions
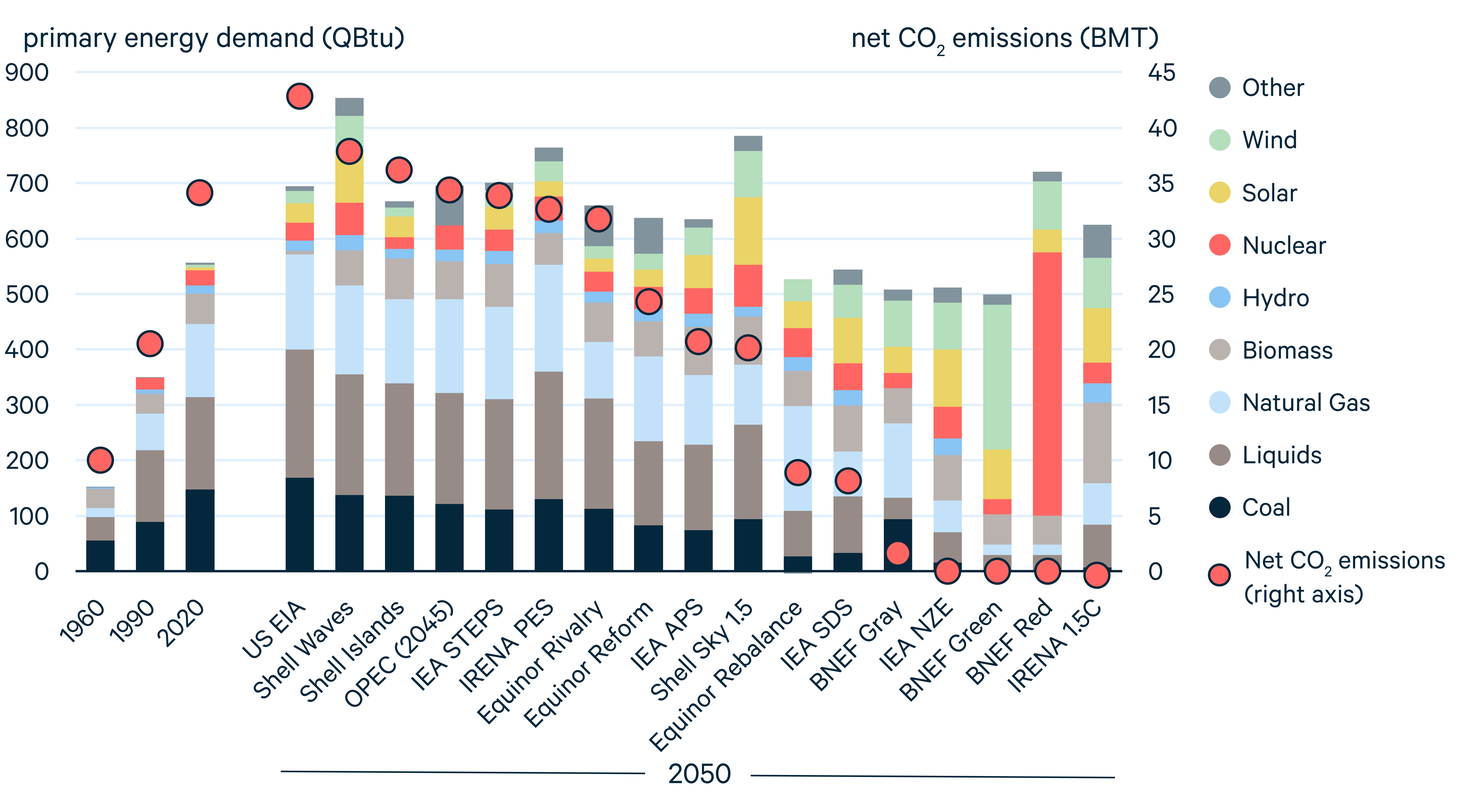
In 2020, coal, oil, and natural gas provided 446 QBtu, or 80 percent, of the world’s primary energy supply. By 2050, the share of fossil fuels in the primary energy mix declines under all scenarios other than the EIA’s Reference Case, but their aggregate level increases under most Reference and Evolving Policies scenarios. Under these scenarios, the world would continue its long history of “energy additions,” where new energy sources build atop, rather than replace, older sources, making it impossible to achieve international climate targets, such as 1.5°C or 2°C.
Under Ambitious Climate scenarios, which are consistent with these long-term climate goals, the aggregate level of fossil fuel demand declines, and their share of the primary energy mix falls even faster. Nonetheless, natural gas and oil continue to play meaningful, if reduced, roles in the global energy system under all of these scenarios, usually paired with carbon capture, use, and storage (CCUS) technologies. Under some scenarios, such as BNEF’s Grey and Shell’s Sky1.5, fossil fuel consumption remains quite high, paired with widespread use of CCUS. In Shell’s Sky1.5, different assumptions about carbon budgets and large-scale negative emissions from the forestry sector also play a major role in achieving the 1.5°C target by 2100 (see Section 3.2).
From 1990–2020, global electricity generation more than doubled. For most years during that period, the share of fossil fuels in the power mix hovered slightly above 60 percent. By 2050, all scenarios project that global power generation will grow by more than 50 percent (more than doubling under most Ambitious Climate scenarios) and the share of fossil fuels will fall below 40 percent.
Figure 3. Global Electricity Mix

Coal, which has been the world’s leading electricity source for generations, declines in absolute terms in the power sector under all scenarios, ranging from a drop of 1 percent below 2020 levels (Shell Waves) to 100 percent (BNEF Green, BNEF Red, and IRENA 1.5C). Under some Ambitious Climate scenarios, such as BNEF Grey, Equinor Rebalance, and Shell Sky1.5, coal continues to play a large role, but its CO2 emissions are sharply reduced through widespread deployment of CCUS.
Natural gas consumption for electricity generation increases by 13–57 percent under Reference and Evolving Policies scenarios (other than IEA APS, which increase just 1 percent) but falls considerably under most Ambitious Climate scenarios. The latter decline hinges on deploying CCUS technologies, negative emissions, and other innovations that could allow the world to reach net-zero emissions by midcentury.
Solar and wind power soar under all scenarios, reflecting their dramatic reduction in costs over the last 10–15 years. Under most Ambitious Climate scenarios, the speed and scale of their build-out from 2020 to 2050 is unprecedented, dwarfing the rates of growth seen to date.
The range of projections for global oil demand reflects the deep uncertainty over the future of the energy system and the widening gap between climate ambition and current policies. The difference between the highest and lowest projections in 2050 is 109 million barrels per day (mb/d), more than 10 mb/d greater than the global demand of 97 mb/d in 2021.
Figure 4. Global Oil Demand
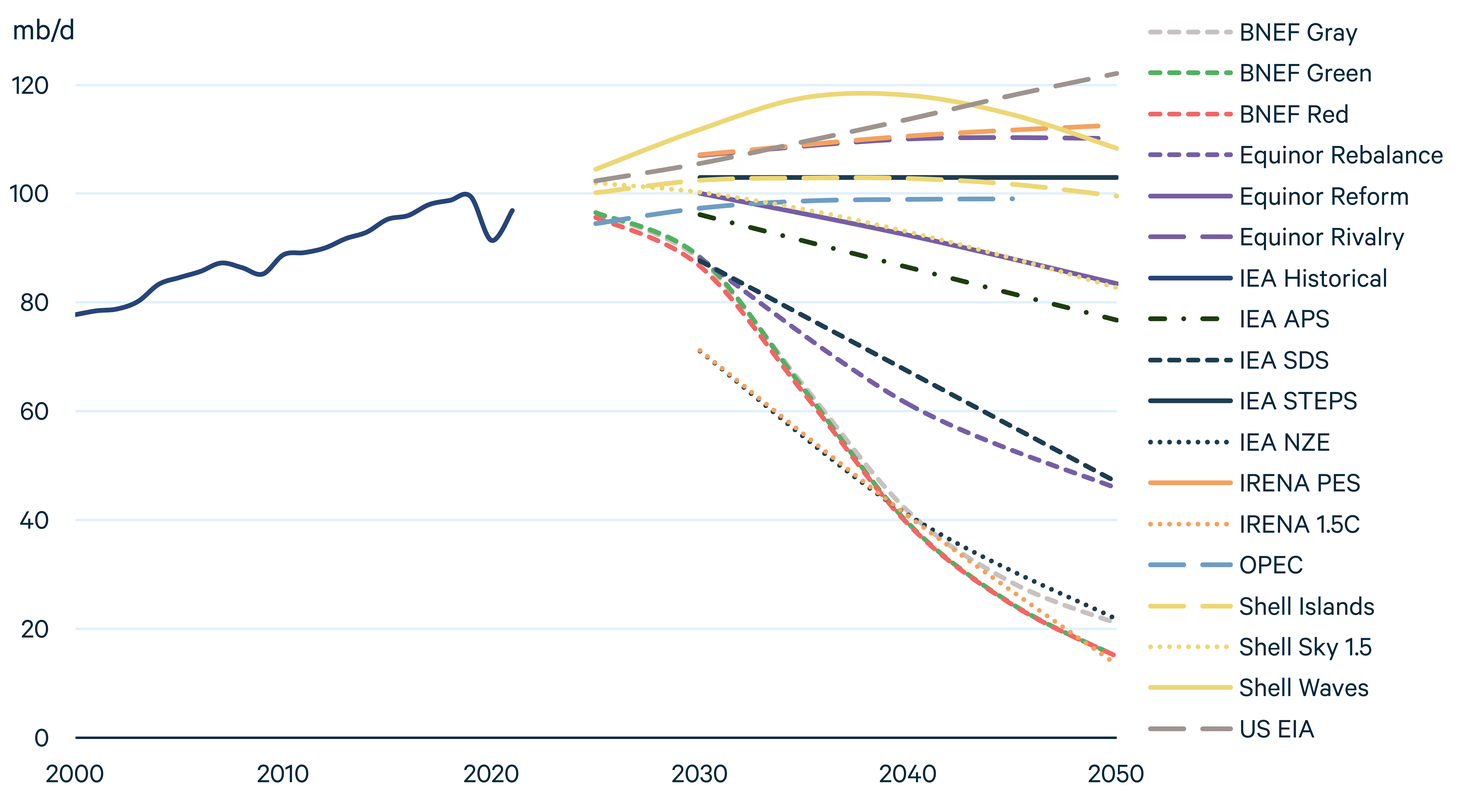
Most Reference and Evolving Policies scenarios envision steady or rising oil demand by midcentury. Under these scenarios, global demand ranges from roughly 84 mb/d (Equinor Reform) to 122 mb/d in 2050 (EIA Reference), including oil and other hydrocarbon liquids but excluding biofuels. The IEA APS, which reflects national pledges in international climate negotiations, sees demand of 77 mb/d in 2050, well above the levels needed to avoid long-term temperature rise of 1.5°C or 2°C.
Ambitious Climate scenarios that are consistent with the 2°C target begin with moderate declines in oil demand from 2021 through 2030, followed by a more rapid decline over the next two decades. These scenarios range from a low of 15 mb/d by 2050 (BNEF Green and Red) to a high of 47 mb/d (IEA SDS).
Interestingly, scenarios consistent with the 1.5°C target show a wider range. At the high end is Shell Sky1.5, where oil demand falls slowly, reaching 83 mb/d by 2050; widespread deployment of CCUS technologies and negative emissions from land use practices allow for relatively high levels of fossil fuel consumption over the next several decades. At the low end, scenarios that rely less heavily on CCUS and negative emissions project oil demand between 13 mb/d (IRENA 1.5C) and 22 mb/d (IEA NZE) by 2050.
Like oil, the range of projections for future coal demand is extremely wide. By 2050, the difference between the highest (US EIA) and lowest (BNEF Green and Red) scenarios is 167 QBtu, considerably larger than the 154 QBtu in global coal demand in 2021. Although coal demand declines over the projection period under all but one scenario (US EIA), the range of outcomes highlights the large gap between current policies and climate ambition.
Figure 5. Global Coal Demand

Because coal typically emits the most CO2 per unit of primary energy consumption and is relatively easily substituted in the power sector—where the bulk of coal is consumed—it declines more rapidly than other fossil fuels in Ambitious Climate scenarios. However, a wide range of coal consumption remains in 2050 even under the 1.5°C and 2°C scenarios. In two scenarios, BNEF Gray and Shell Sky1.5, large-scale CCUS deployment enables coal to maintain a large role in the primary energy mix by 2050. Under other scenarios, which have more modest assumptions around CCUS deployment, coal approaches zero by midcentury.
The Reference and Evolving Policies scenarios also have a wide range of projections. For example, Reference scenarios from OPEC and US EIA differ by roughly 45 QBtu in 2045, the final year of OPEC’s projection. Evolving Policies scenarios also differ considerably, ranging from 2050 demand of 112 QBtu in IEA STEPS to 83 QBtu in Equinor Reform. The IEA APS, which sees coal demand of 74 QBtu in 2050, highlights the remaining gap between current and recently announced policies.
As with all other fossil fuels examined in this year’s outlook, the range of projected natural gas demand in 2050 is considerably wider than global demand in 2021. All Ambitious Climate scenarios envision lower natural gas demand in 2050 than 2021, and all Reference scenarios project considerably higher demand. The difference between the lowest (BNEF Green and Red) and highest projections (IRENA PES) is 188 trillion cubic feet (tcf), 30 percent more than 2021 global demand.
Figure 6. Global Natural Gas Demand
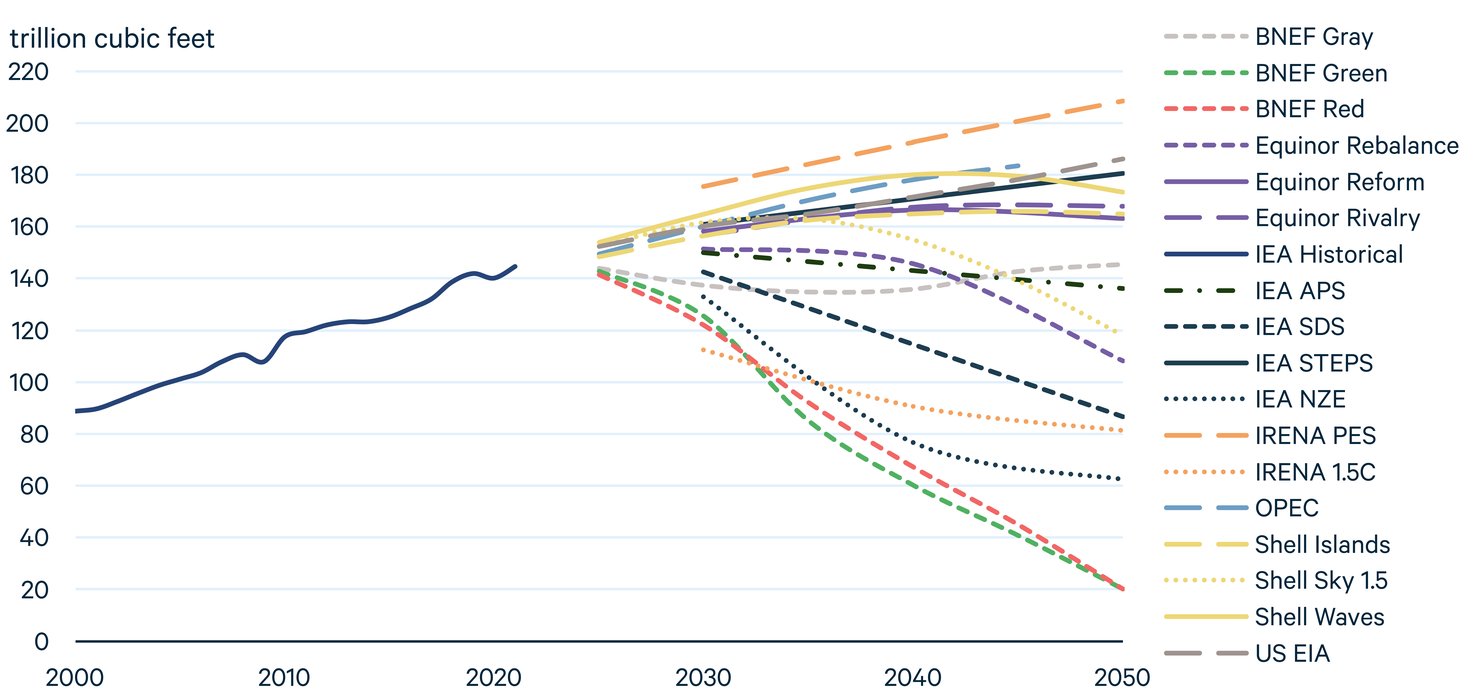
Compared with coal and oil, natural gas experienced a modest drop in 2020 demand due to the effects of the COVID-19 pandemic. Natural gas demand remains steady through 2025 under all scenarios, but large differences emerge in the next 5–10 years. Under Ambitious Climate scenarios, demand drops considerably by 2030, except for BNEF Grey, Equinor Rebalance, and Shell Sky1.5; these scenarios rely heavily on large-scale CCUS deployment.
Most Reference and Evolving Policies scenarios project considerable demand growth for natural gas through the next several decades. However, most of them envision slower growth than the trends observed over the last two decades. From 2000 to 2020, global natural gas demand grew by roughly 51 tcf. Over roughly the next 20 years, only the IRENA PES sees a similar increase above 2020 levels (52 tcf higher in 2040). The US EIA Reference scenario projects slower growth in natural gas demand, due in part to higher projections for future coal use, which slows the rise of natural gas in the power sector.
Solar and wind electricity generation will likely play a central role in achieving the world’s long-term energy and climate goals. Ambitious Climate scenarios envision unprecedented growth for both sources. For example, the IEA NZE adds 602 GW of solar generation capacity annually from 2030 through 2040, roughly equal to the global cumulative capacity of 605 GW installed through 2019. Under Reference and Evolving Policies scenarios, wind and solar still are at least 2.5 and seven times higher, respectively, in 2050 than 2020.
Figure 7. Global Solar and Wind Electricity Generation

In 2021, wind produced roughly twice as much electricity as solar globally. But outlooks differ in projections of their relative contribution. BNEF’s three scenarios envision wind producing 78–113 percent more electricity than solar by 2050, and IRENA’s two scenarios project wind providing 17–47 percent more. However, all other scenarios project that solar will produce more electricity than wind by 2050.
Some of the lowest projections for wind and solar energy growth come from Equinor Rivalry and Shell Islands. These scenarios, which envision heightened geopolitical tensions and increased economic isolationism, highlight the notion that global supply chains play an important role in the deployment of low-cost clean energy technologies. In recent years, however, nations have reassessed their reliance on global supply chains after disruptions from COVID-19, China’s increased dominance in many essential materials and components, and the unfolding events in Ukraine. Investments in domestic supply chains will enhance resilience to future shocks but may also raise the cost of, and therefore potentially slow, the deployment clean energy.
Bioenergy is a substantial part of the global energy mix and has primarily consisted of nonmarketed biomass. Under some projections, however, commercial bioenergy—in solid, liquid, and gaseous forms—grows to play a much larger role, and improved access to modern energy services in lower-income regions reduces demand for traditional biomass.
Figure 8. Global Bioenergy Demand

Outlooks reflect a wide range of possibilities for bioenergy use. In some scenarios, such as IEA SDS, IEA NZE, and IRENA 1.5C, traditional use of biomass falls to zero by 2030, reflecting UN Sustainable Development Goal 7, which aims to provide access to modern energy services for all people globally. These scenarios also envision a rapid scale-up of modern solid bioenergy, liquid biofuels, and biogases. By 2050, bioenergy plays a major role in the global energy system under IEA APS, IEA SDS, IEA NZE, and particularly the IRENA 1.5C scenario, ranging from 19 to 23 percent of the primary energy mix. In IEA SDS, IEA NZE, IRENA 1.5C, and Shell Sky1.5, bioenergy is paired with CCUS to produce large-scale negative emissions.
Although this technological pathway also appears in many of the scenarios modeled for the IPCC’s 2018 report on limiting long-term temperature rise to 1.5°C, concerns arise over competition for alternative land uses, water consumption, and other impacts of such a dramatic expansion. For example, IRENA’s 1.5C envisions modern biomass consumption nearly tripling from today through 2030, and biofuels (including both gases and liquids) more than quadrupling by 2030. Of course, the unprecedented speed and scale of wind and solar deployment envisioned in most Ambitious Climate scenarios raises related questions about future land use.
Population and economic growth in Africa are projected to outpace most other regions, and energy demand growth will result. Under most scenarios, Africa’s share of global primary energy consumption grows considerably—from 6 percent in 2020 to 8–11 percent in 2050 in scenarios other than US EIA. For US EIA Reference, which excludes nonmarketed biomass, Africa’s share grows from 3.5 to 5.2 percent by 2050.
Figure 9. Primary Energy Demand in Africa in 2050

Africa’s largest source of primary energy is biomass and waste, led by nonmarketed biomass (solid fuels and waste harvested and burned locally to provide home heating and cooking fuel). Nonmarketed biomass causes significant health impacts and physical risks for those—often women—who harvest and burn it. In 2020, biomass and waste accounted for 45 percent of Africa’s primary energy consumption. By 2050, scenarios project that share to decline to 17–35 percent. In some scenarios, such as the IEA SDS, nonmarketed biomass reaches zero and modern bioenergy grows significantly.
Coal, which accounted for 13 percent of Africa’s primary mix in 2020, grows under five of the eight scenarios, rising by as much as 40 percent under US EIA High Economic Growth and falling by more than 80 percent under IEA SDS. Oil and natural gas rise under all scenarios, ranging from 19–174 percent growth for oil and 4–145 percent growth for natural gas. Nuclear and renewable energy resources grow rapidly under all scenarios, but from a small base and with wide ranges across scenarios. In Ambitious Climate scenarios, solar grows to play a major role in Africa’s energy mix.
Fueled by its extraordinary economic rise, China’s energy use more than quadrupled from 1990 to 2020. Over the next 30 years, all scenarios envision much slower energy demand growth for China, ranging from 39 percent under the highest (US EIA High Economic Growth) to a decrease of 20 percent under the lowest (Equinor Rebalance). Coal, which accounted for 60 percent of primary energy in China in 2020, declines under most scenarios and falls dramatically under Ambitious Climate scenarios.
Figure 10. Primary Energy Demand in China in 2050

China’s liquids demand, which increased dramatically from 1990 to 2020, continues to grow quickly under Reference scenarios, moderates under Evolving Policies scenarios, and declines under Ambitious Climate scenarios. In IEA STEPS, 2050 demand is roughly equal to the 2020 level, and China’s announced climate pledges, represented by the IEA APS, sees demand falling by more than half.
Natural gas, on the other hand, stays roughly flat or increases in China under all scenarios. Demand doubles or triples under Reference scenarios, rises by 60 percent under the IEA STEPS, and remains roughly flat under IEA APS and SDS. Equinor Reform and Rebalance both envision relatively strong growth of natural gas, which displaces coal in China’s power sector.
Nuclear and renewables grow dramatically in China under all scenarios. Even under the most bearish scenarios (US EIA Reference), nuclear nearly triples over the next 30 years. Wind energy grows from 1.6 QBtu in 2020 to 3.4 QBtu in 2050 under the lowest scenario (EIA Reference) and to 14.4 QBtu under the highest (IEA APS and SDS). China’s solar growth is even more rapid, rising from 2.0 QBtu to between 5.7 QBtu (Equinor Rivalry) and 23.6 QBtu (IEA APS) by 2050.
3. In Focus
3.1. Global Oil Markets in Upheaval
Global oil markets have ridden a roller coaster over the last two years. In the first four months of 2020, as the COVID-19 pandemic crushed the demand for transportation fuels, spot prices for Brent crude, a standard international benchmark, fell from $70 per barrel (bbl) to less than $10/bbl. In the United States, benchmark West Texas Intermediate crude briefly traded at negative prices.
Over the following 18 months, however, Brent prices marched haltingly upward, passing $80/bbl by October 2021, and leading to higher fuel prices for consumers. In response to these higher prices, the United States and several other nations released inventories from their strategic petroleum reserves (SPR). Just three days later, the World Health Organization designated the Omicron strain of COVID-19 a “variant of concern,” renewing fears of public health and economic disruptions that sent oil prices to below $70/bbl in late November and early December.
Since that time, however, oil markets have reflected optimism about the global economy recovery and rising oil demand, despite the spread of Omicron. By early 2022, prices had again climbed above $80/bbl.
But in late February 2022, after weeks of amassing troops and materiel at the border, Russia launched a full-scale invasion of Ukraine, creating a humanitarian crisis and ushering in a potentially prolonged period of instability in Europe. Russia is the world’s third largest oil producer behind the United States and Saudi Arabia and is the world’s second largest crude exporter (after Saudi Arabia). Russia exported about 5 mb/d in crude oil and almost 3 mb/d in petroleum products in late 2021, according to the IEA. This instability, coupled with government sanctions, private-sector boycotts against Russia, and the exit of several IOCs from operations in Russia therefore sent global prices shooting up. Brent crude rose above $100/bbl in February, approached $130/bbl in early March, and as of this writing was hovering around $110-115/bbl.
On March 1, 2022, the IEA announced a coordinated release of 60 million barrels of oil from member nations’ SPRs. But global prices continued to surge following the announcement, reflecting concerns over the reliability of supply from Russia in the weeks, months, and years ahead.
Figure 11. Global Oil Prices, COVID-19, and Russia’s Invasion of Ukraine
It is impossible to know how the current crisis will evolve and affect energy markets in the months, years, and decades ahead. But some early developments may offer insight. International oil companies, such as BP, Shell, and ExxonMobil, have announced that they are withdrawing from multibillion-dollar investments in Russian oil and natural gas projects. Major oilfield service providers such as Baker Hughes, Halliburton, and Schlumberger also announced pauses in their operations. This will likely make it more difficult for Russia to develop its hydrocarbon resources, potentially reducing global supplies, which would tend to increase prices.
Russia’s invasion has reinforced the desire for many European nations to reduce their dependence on energy supplies from Russia, a strategy that aligns with Europe’s long-term climate goals and would tend to push prices downward. In a March 2022 analysis, IEA highlighted multiple strategies that Europe could take to reduce reliance on Russian energy in the near term. Along with diversifying suppliers, it recommended new standards to increase natural gas storage, accelerate electrification of buildings, more rapidly deploy wind and solar, increase generation from existing nuclear and bioenergy facilities, and more.12 Roughly one week later, the European Commission announced a suite of actions largely consistent with the steps articulated by IEA.
Some US policymakers have highlighted the role that US natural gas exports could play in reducing Europe’s dependence on Russia. While US LNG export capacity expansions are on track to make the US the world’s largest exporter by the end of 2022, it takes years to plan and build such facilities, and physical limitations of both liquified natural gas (LNG) export (in the US) and import (in Europe) capacity suggest that the United States will be limited in its ability to obviate Europe’s reliance on Russian energy imports, especially in the near term.
Even before the Russian invasion of Ukraine, policy and market trends were leading many analysts to the conclusion that oil price volatility would rise in the years ahead, raising concerns for producers and consumers and highlighting the practical challenges of deeply reducing greenhouse gas emissions. We explore these dynamics in the remainder of this section.
3.1.1. Driving demand
Global oil demand rebounded relatively quickly after its collapse in 2020 but remains below its 2019 levels of 99.7 mb/d. In its Oil2021 report, which assesses market trends through 2026, IEA projects that global demand will surpass the 2019 level by 2023 and then grow at nearly 1 mb/d per year, reaching 104.1 mb/d by 2026.
Despite considerable uncertainty, the projections highlight the central role of developing nations in driving future demand. Non-OECD economies, led by China, India, and southeast Asia, lead annual demand growth of about 1 mb/d, while oil consumption in OECD nations flattens at about 46 mb/d and does not return to prepandemic levels (Figure 12).
Figure 12. Medium-Term Oil Demand Projections
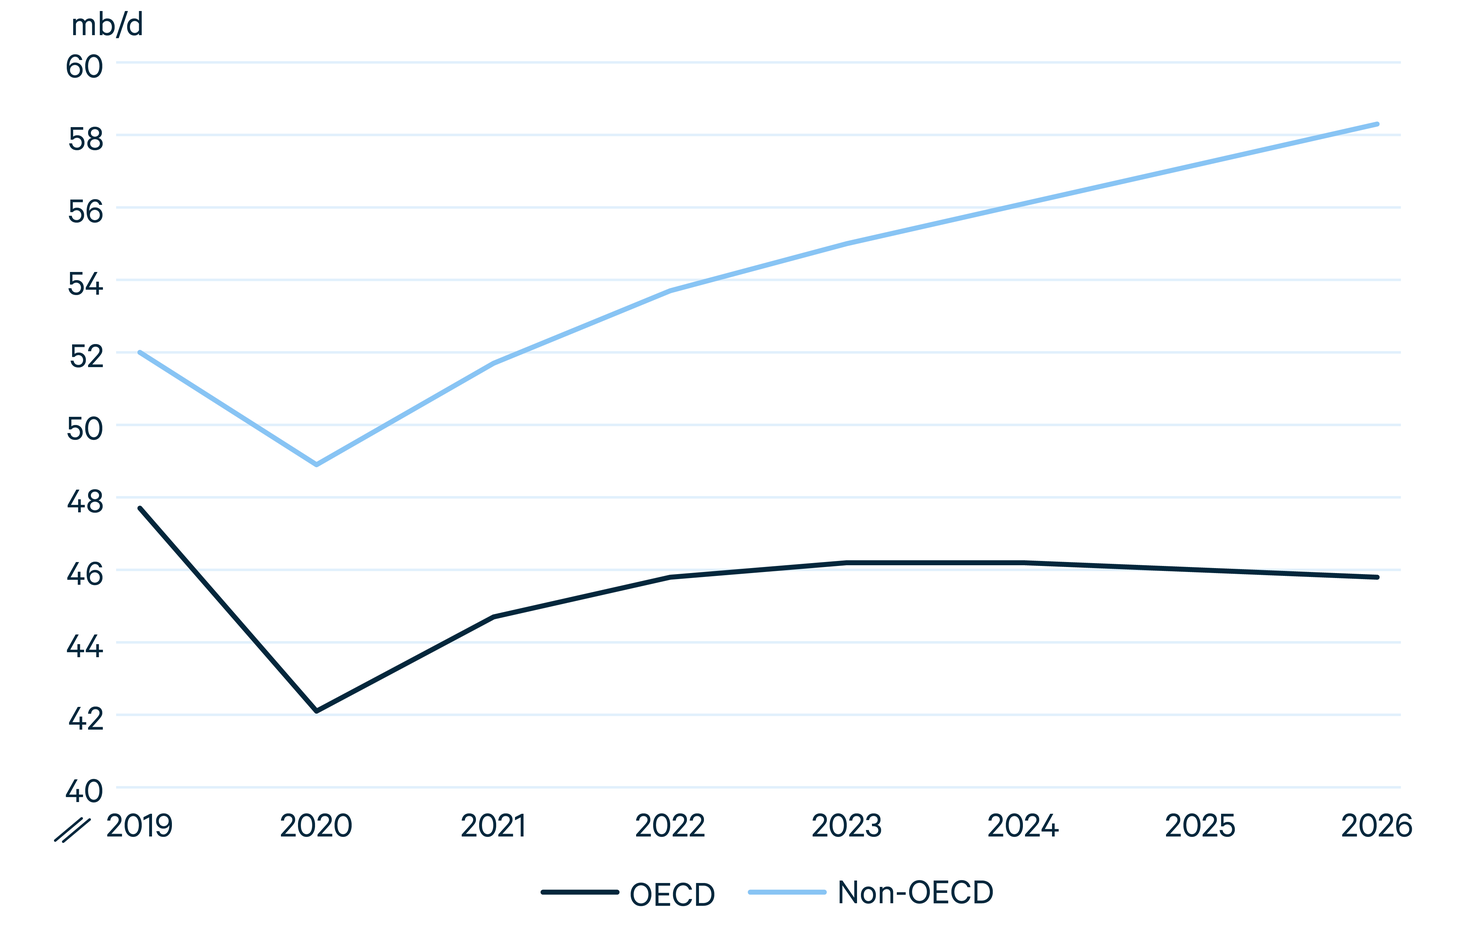
The IEA’s analysis also points to petrochemicals as the main driver of medium-term growth, led by the United States and China. Demand for ethane and naptha, two of the leading feedstocks for petrochemicals production, grows much more strongly than transportation fuels, and global gasoline demand declines moderately as electric and energy-efficient vehicles become more prevalent. Nonetheless, demand for transport fuel continues to grow strongly in developing nations, led again by China, India, and developing Asia and also the expanding market share of sport utility vehicles around the world.14
3.1.2. Suppressing supply
Despite the need to reduce oil consumption to address the risks of climate change, the demand trends noted earlier (see Figure 4) illustrate that the world is not doing enough. If, as many projections suggest, global oil demand rebounds above prepandemic levels, supply shortages could usher in a new period of high prices, even setting aside recent concerns about Russian supplies.
Oil market analysts have warned for years that investment in new oil production capacity outside of US tight oil has lagged expected demand in the medium term and would likely result in volatile prices.15 Even prior to Russia’s invasion of Ukraine, this dynamic was exacerbated by several factors, including depressed investment due to low prices stemming from the pandemic, investor uncertainty about future oil demand under climate policy, investor skepticism over whether the US tight oil production can become more profitable, and pressure on lenders from civil society and advocates to reduce investment in all fossil fuel projects.16
The combination of these factors meant that 2020 investment in global upstream oil and gas development fell to its lowest level since 2006, less than half of the investments made in 2014.16 In 2021, new discoveries of oil and gas fields reached their lowest levels in 75 years, according to one recent analysis.17 If these reductions in supply are not met with reduced demand in the coming months and years, oil prices could be headed even higher. Although higher oil prices could destroy some demand, thereby reducing greenhouse gas emissions, the economic costs of reducing oil consumption through high and volatile prices will be far higher than reducing consumption through predictable policy on the demand side.
3.1.3. The wide-open range
Although most outlooks do not publish oil price projections, we can glean insight from two that do: IEA and US EIA. Like projections for future fossil fuel demand, the range in 2050 prices is very wide, from $24/bbl in the IEA NZE to $173/bbl in the US EIA high oil price scenario, in inflation-adjusted real $2020/bbl. This range reflects the enduring uncertainty related to global oil markets and is even larger than recent swings in oil prices, from the 2020 lows of $10–$20/bbl to the early 2022 highs above $120/bbl (Figure 13).
Figure 13. Historical and Projected Brent Crude Prices (inflation-adjusted)
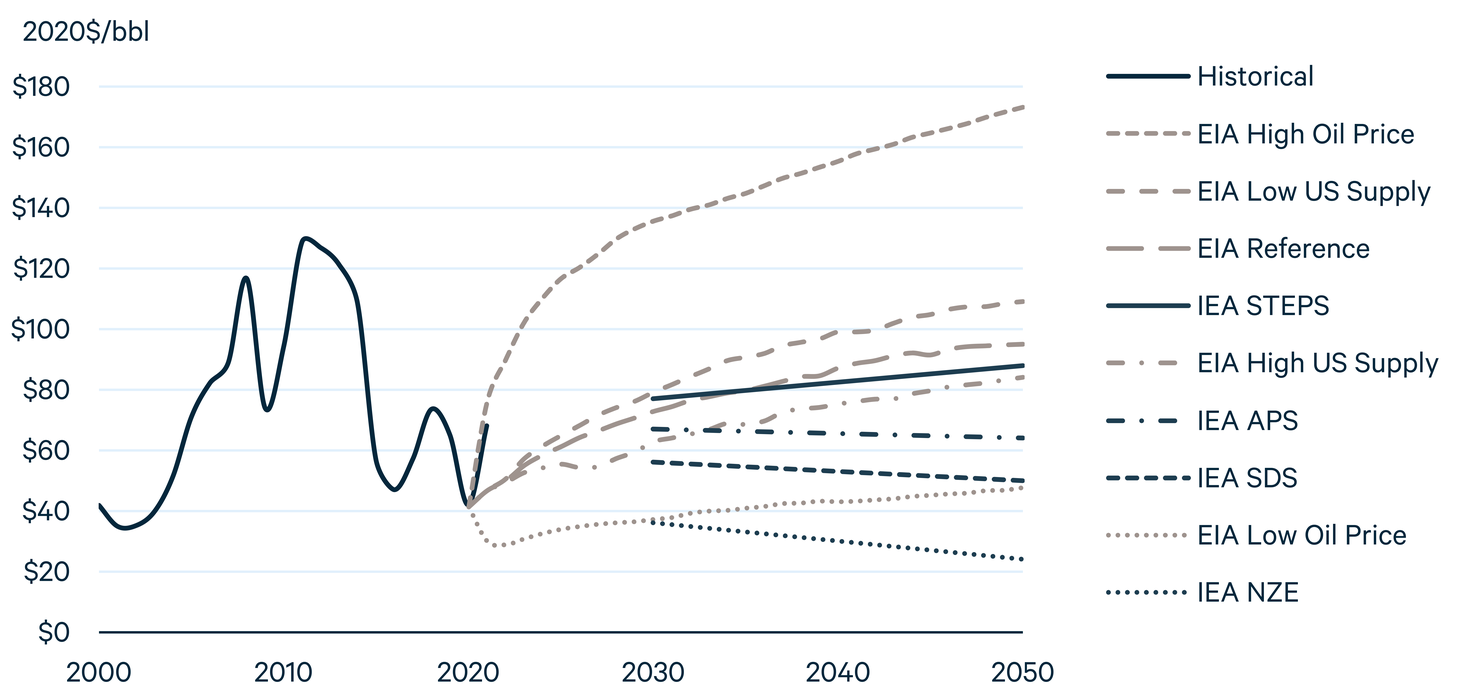
In broad terms, price projections are fairly similar under central scenarios for each outlook (IEA STEPS and US EIA Reference), reaching the high $80/bbl to low $90/bbl range by 2050. The US EIA scenarios exploring alternative paths for future US crude production illustrate the relatively newfound influence that tight oil producers have had on global markets, with 2050 prices varying from $84/bbl under a high US supply scenario to $109/bbl under a low US supply scenario. These price effects could be muted by future OPEC supply decisions but nonetheless reflect the major influence that US producers have come to have in the global oil market.
The IEA scenarios primarily reflect major shifts in oil demand, with dramatic reductions in consumption under Ambitious Climate scenarios (NZE and SDS), moderate declines under the APS, and steady demand under the STEPS. Under low-demand scenarios, producers with the lowest costs, best access to markets, and—depending on policy—lowest upstream emissions profiles could continue to produce profitably. Higher-cost producers would struggle to profit under these low demand scenarios and would likely reduce production accordingly.
However, most investment decisions that determine medium- and long-term oil supply require many years of planning. Given this extended time horizon for investment decisions, and the extremely uncertain nature of current—and projected future—oil demand and prices, producers will need to make decisions that are robust to a wide range of possible futures.
Since their inception, oil markets have been volatile and unpredictable. It seems likely that the coming years—if not decades—will offer more of the same.
3.2. Addressing Uncertainty in Future Global CO2 Emissions
The future of the energy system and CO2 emissions face deep uncertainty, which leads to uncertainty about the expected magnitude of harms due to global warming. Most of the energy outlook scenarios belong to suites of narratives intended to address this uncertainty. However, the relative likelihood of different outcomes is typically not quantified. In this section, we compare the emissions trajectories in the 2021 energy outlooks to new probabilistic emissions projections created by the RFF Social Cost of Carbon Initiative, called the “RFF Socioeconomic Projections” (RFF-SPs).
These projections were developed using a combination of statistical modeling and expert surveys. Rather than parsing specific policies, geopolitics, economic development trajectories, fuel mixes, and the like, a group of experts condensed their knowledge on these topics into estimated probabilistic ranges of future emissions (e.g., a 5 percent chance of global CO2 emissions being below x Gt in year y). These ranges were combined with historical emissions data.18
Figure 14 shows the global CO2 emissions predicted by the RFF-SPs alongside scenarios from the 2021 energy outlooks. The solid light blue line represents the median value; the shaded blue ranges represent 50 percent and 90 percent prediction intervals (bounded by the 25th and 75th percentiles and the 5th and 95th percentiles, respectively). In the near term, the median RFF-SP trajectory shows moderate growth, almost matching the Shell Waves scenario in 2025. The median RFF-SP declines to roughly the same level as IEA STEPS by 2040 and then declines more quickly.
Figure 14. World CO2 Emissions Projections
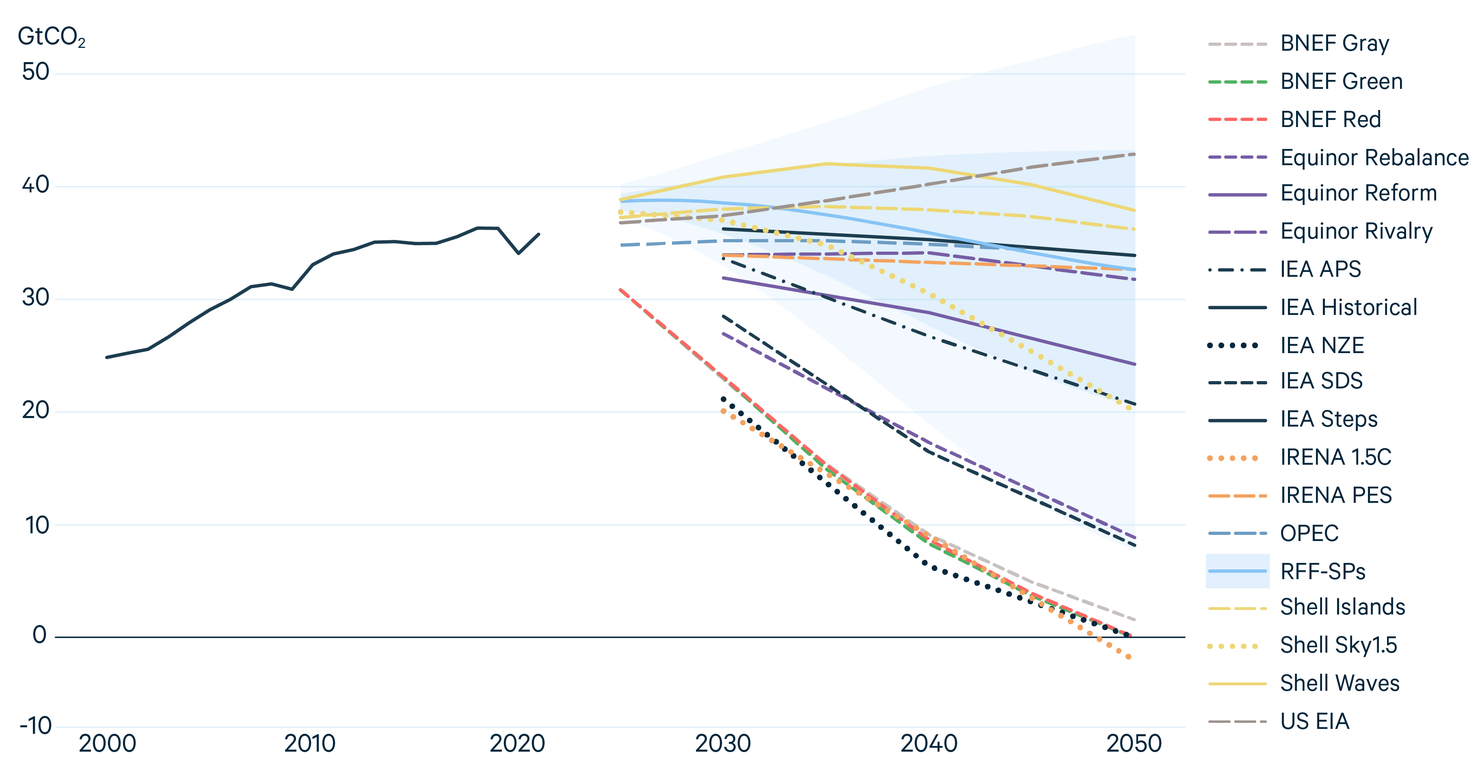
In 2050, all Reference and Evolving Policy scenarios fall within the interquartile range of the RFF-SPs (i.e., between the 25th and 75th percentile of outcomes). In absolute terms, annual emissions in the Reference and Evolving Policy scenarios are within 12 Gt CO2 of the RFF-SPs in all years through 2050. Equinor Rebalance, IEA SDS, and Shell Sky1.5 fall between the 5th and 25th percentiles,ii leaving the five other Ambitious Climate scenarios in the bottom 5 percent of outcomes predicted by the RFF-SPs (this remains true regardless of whether the RFF-SPs include emissions from land-use change and forestry, including negative emissions).
Although several scenarios fall well below the 5th percentile of the RFF-SPs, no scenario is in the upper 25th percentile. There are at least three possible explanations for this. First, all scenarios in 2021 energy outlooks represent current policies or enhanced ambition toward reducing global emissions rather than the potential for backsliding. This choice reflects the desire for energy system futures that move away from the persistent upward trend in global CO2 emissions. However, we should recognize that a continuation of historical trends is a plausible—if undesirable—outcome.
A second reason is that 2021 outlooks, despite their wide variation in assumptions, do not incorporate the full range of uncertainty around important emissions drivers such as population and economic growth, geopolitics, new technologies, or discoveries of new fossil fuel resources. The RFF-SPs do incorporate these uncertainties, which could lead to higher or lower emissions than expected even under a given narrative about the future. Last, this version of the RFF-SPs excludes negative emissions, but other scenarios include them, which reduces net emissions considerably in most Ambitious Climate scenarios.
The wide range of future outcomes across scenarios and within the RFF-SPs illustrates that a very wide range of future emissions, and hence climate outcomes, are possible. Net emissions in most Ambitious Climate scenarios fall well below what is suggested by historical trends and the Reference and Evolving Policies scenarios. This highlights the need for exceptional changes to achieve long-term climate targets, such as 1.5°C or 2°C. As discussed in other sections of this report, those changes could include dramatic improvements in energy efficiency, CCUS, electrification of end-use sectors, or nuclear energy.
Finally, a substantial difference exists between historical CO2 emissions from some sources, which lead to notable differences in projection outcomes. This difference is driven by two distinct accounting approaches that use either “top-down” (based on total energy supply) or “bottom-up” (sector-by-sector) methods.19 For example, Shell uses a top-down approach, leading to higher historical energy sector CO2 emissions data than IEA and its bottom-up approach. Shell historical data closely match the source used by the RFF-SPs, which likely explains the relative similarity between these two sets of projections in the near term. As noted, the version of the RFF-
SPs presented here excludes negative emissions, setting it apart from most other scenarios.
3.3. Will Global Energy Demand Continue to Grow?
Since the Industrial Revolution, energy demand has closely tracked population and economic growth. However, some scenarios depict a future where this link is less fixed, driven primarily by the need to reduce greenhouse gas emissions. As shown in Figure 15, most outlooks show higher energy demand in 2050 than 2020. However, global energy demand growth is not a certainty, particularly under scenarios where government policies and/or technological breakthroughs fundamentally alter the nature of the world’s energy system.
Figure 15. World Primary Energy Demand
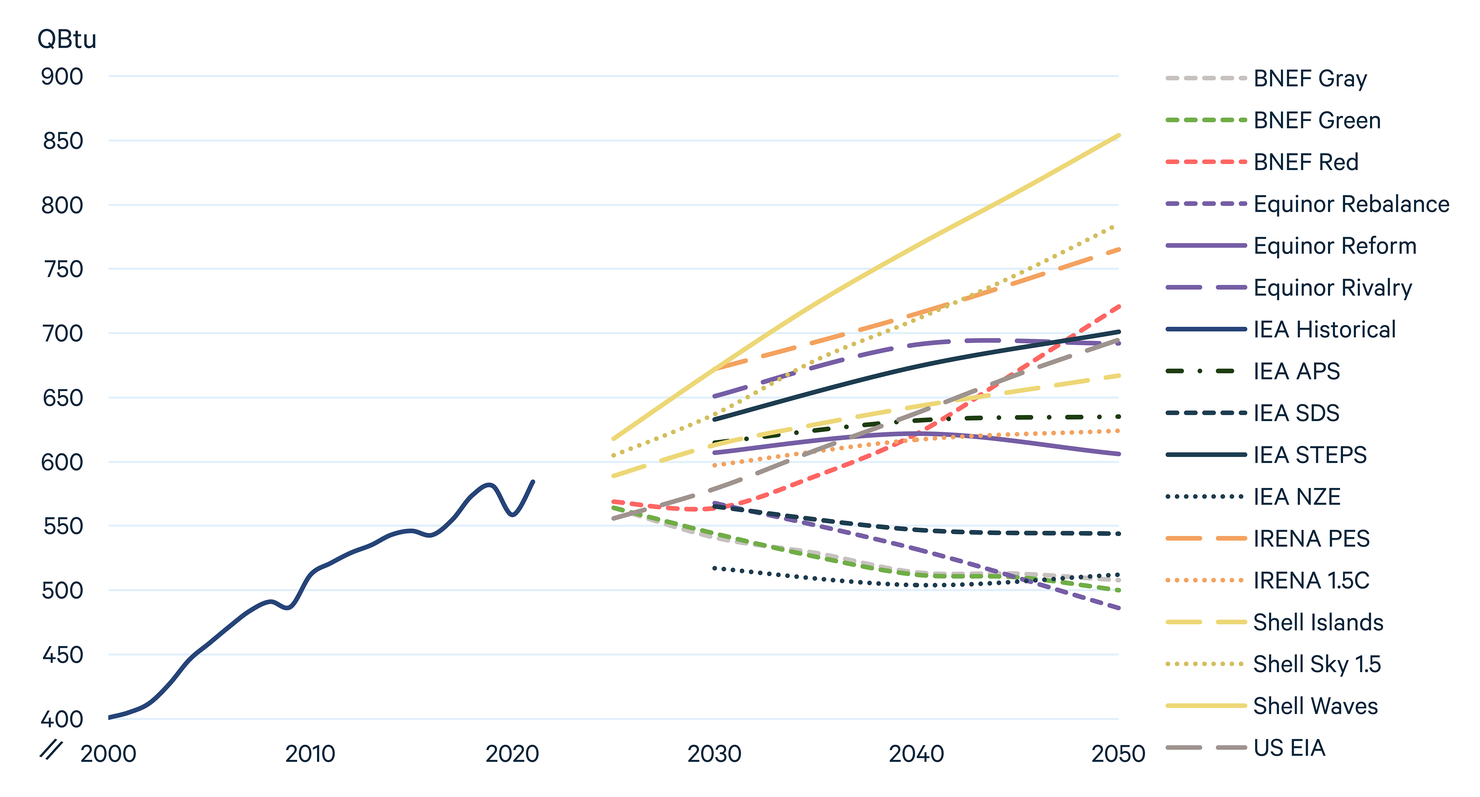
Most scenarios project considerable growth in global energy demand, increasing by as much as 53 percent by 2050 (Shell Waves) from 2020 levels. The middle scenario (IEA APS) projects growth of 14 percent, and IEA STEPS projects growth of 26 percent. Under several Ambitious Climate scenarios, global demand is 8–13 percent lower in 2050 than 2020. To place this in perspective, the prior 30-year period from 1990 to 2020 saw a 59% increase in global energy demand. Figure 16 illustrates the range of growth observed in the different scenarios.
Figure 16. World Primary Energy Demand in 2050 Compared to 2020

To understand some underlying drivers of these changes, we turn to components of the Kaya Identity, a group of factors introduced to assess the drivers of CO2 emissions. These factors include population, GDP per capita, energy use per unit GDP (i.e., energy intensity), and CO2 emissions per unit energy used (i.e., carbon intensity). In a world where global population and economic activity are both increasing, the Kaya Identity tells us that energy intensity and/or carbon intensity must decrease for CO2 emissions to fall. Table 3 highlights some of these factors alongside aggregate changes in energy demand and changes in demand per capita, with scenarios ordered by decreasing level of aggregate energy demand growth.
Other important markers of change included in Table 3 are energy demand per capita, which introduces the impact of each outlook’s population predictions, and change in energy demand. To place these figures in perspective, the 30-year period 1990-2020 saw a 59 percent increase in energy demand, 8 percent increase in energy per capita, 39 percent decrease in energy intensity, and 4 percent decrease in carbon intensity.
3.4. The Climate Ambition Gap
While rhetoric in favor of policies to mitigate climate change has grown louder in recent years, progress toward achieving a rapid energy transition remains slow. The climate “ambition gap” represents the difference between our current emissions trajectory and a future consistent with limiting global warming to 1.5°C or 2°C by 2100.
This ambition gap is clearly visible throughout this report. Reference and Evolving Policies scenarios share a broadly similar path, with total energy consumption rising through 2050 and CO2 emissions remaining near their 2020 levels (Figure 2). Ambitious Climate scenarios, however, usually see decreases in primary energy consumption and drastic reductions in CO2 emissions. Although most Ambitious Climate scenarios are aligned in the broad strokes of how energy demand and emissions change, they vary along a number of dimensions.
3.4.1. Ambitious Climate scenarios
Ambitious Climate scenarios vary considerably in their levels of fossil fuel use, CCS deployment, and—in some cases—total energy demand. In this section, we compare these scenarios with IEA STEPS, a reasonable representation of the current path of the energy system given current and expected policies.
Compared to the IEA STEPS in 2050, all Ambitious Climate scenarios see reductions in fossil fuel demand, though with wide variation. In BNEF Green and Red, IRENA 1.5C, and IEA NZE, coal demand is at least 85 percent lower than IEA STEPS, whereas in BNEF Gray and Shell Sky1.5 coal use is roughly 15 percent lower. For liquids, 2050 demand ranges from 49 (IEA SDS) to 86 (BNEF Green and Red) percent lower. Only under Shell Sky1.5, which relies heavily on negative emissions in the second half of the twenty-first century, do liquids remain similar to today’s levels.
Table 3. Change in Kaya Identity Factors and Other Variables 2020–2050
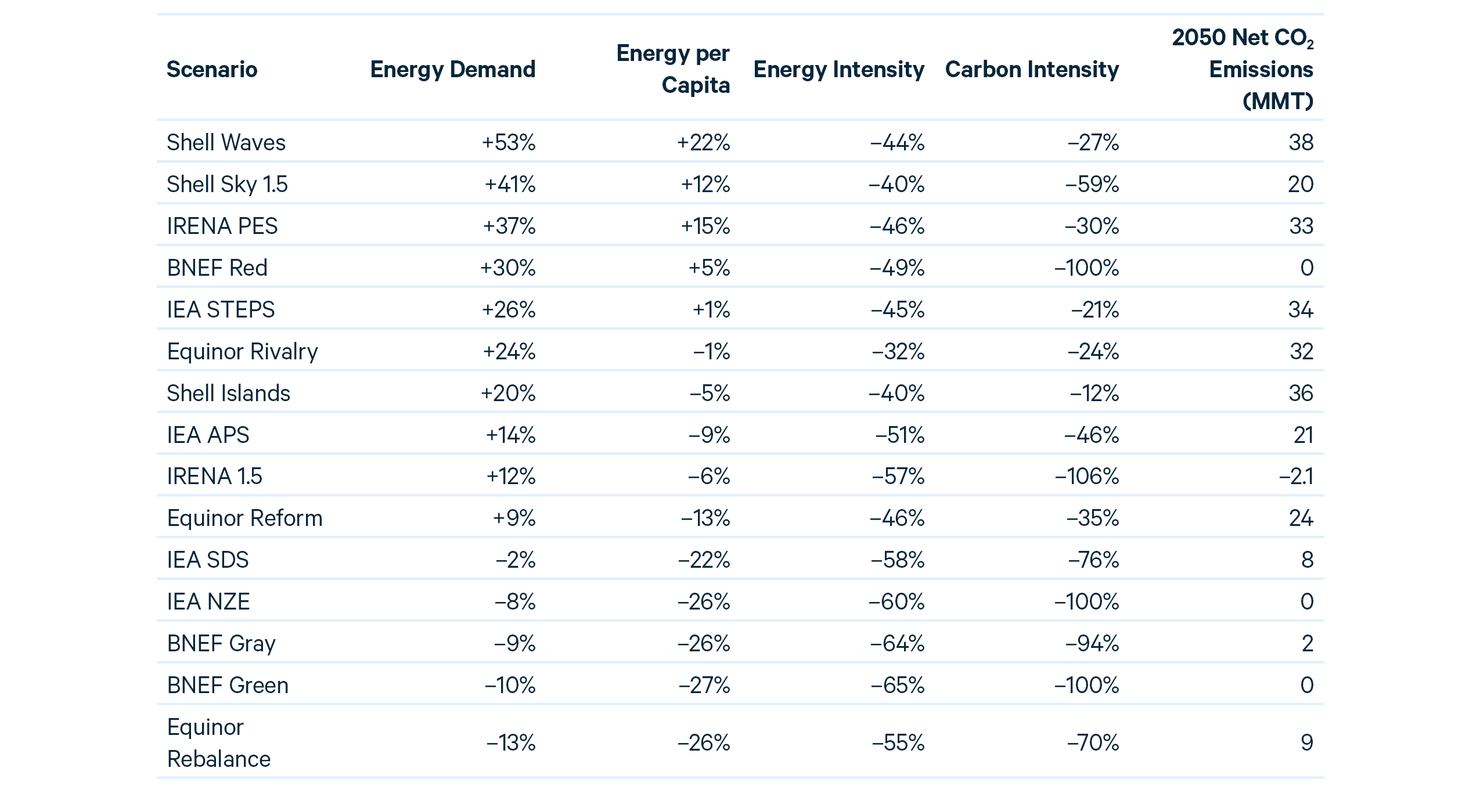
Scenarios that reduce emissions to zero or lower vary widely in their projections for future energy use. Shell Sky1.5 shows the largest growth in energy demand of all scenarios designed to limit temperatures to 1.5°C by 2100. The projection achieves that goal through a decreasing carbon intensity brought on by the large-scale investment and deployment of renewables, such as wind and solar, coupled with large-scale negative emissions in the second half of the twenty-first century. As noted, Shell Sky1.5 is an “overshoot” scenario, where temperatures exceed 1.5°C prior to 2100 and then decline in the final decades of the century due to large-scale negative emissions.
BNEF Red shows a 30 percent aggregate increase in energy demand, 5 percent increase in energy per capita, and 49 percent decrease in energy intensity. This energy future is fueled by a massive expansion in nuclear energy to produce “red” hydrogen and electricity, with nuclear soaring from 5 percent of the energy mix in 2020 to 66 percent in 2050. This is the only scenario included that dramatically expands nuclear power by 2050, allowing the phase-out of fossil fuels and a net-zero economy.
Most other Ambitious Climate scenarios envision energy efficiency playing a central role in limiting global temperature rise. Several of these scenarios, such as the IEA SDS and NZE, lay out a vision where global energy demand declines but access to modern energy services is also achieved for 100 percent of the world’s population, consistent with the UN’s Sustainable Development Goal 7.
Figure 17. World Primary Energy Mix of Ambitious Policies Scenarios in 2050

Demand for natural gas also varies widely across Ambitious Climate scenarios in 2050. The IEA’s SDS and NZE scenarios are 51 percent and 55 percent below STEPS, Equinor’s Rebalance is 61 percent lower, and all three BNEF scenarios are over 80 percent lower.
While most Ambitious Climate scenarios see lower primary energy consumption in 2050 compared to IEA STEPS, the BNEF Red and Shell Sky1.5 scenarios project higher levels of aggregate energy use. For BNEF Red, fossil fuel demand is nearly entirely replaced by nuclear, which grows to 17 times its 2020 levels. Nuclear plays a mixed role in other outlooks, with demand ranging from 11 percent below (BNEF Green) to 38 percent above (Shell Sky1.5).
Renewables see the greatest difference in growth between Ambitious Climate and Evolving Policies scenarios; although all scenarios project considerable renewables growth (Figure 7). Among the 2°C scenarios, BNEF Red and Gray and Equinor Rebalance differ by less than 20 percent from IEA STEPS in 2050, whereas IEA SDS and BNEF Green are roughly double STEPS in 2050. The 1.5°C scenarios of IRENA 1.5C, IEA NZE, and Shell Sky1.5 are roughly 2.4-, 2.5-, and 2.9-fold STEPS, respectively.
Nearly all Ambitious Climate scenarios project wind demand to be more than double that of IEA STEPS by midcentury. The 1.5°C scenarios range from 2.8 to 3.1 times that of IEA STEPS in 2050. Among the 2°C scenarios, IEA SDS and BNEF Gray and Red are 2–3 times the levels seen in IEA STEPS, and Equinor Rebalance is 35 percent higher. BNEF Green is by far the most aggressive scenario for wind, which contributes dramatically to not only electricity generation but also hydrogen production. By 2050, wind energy is more than eight times the level of IEA STEPS.
3.4.2. Slow policy progress leads to steeper reductions in the future
Each year that global policies fail to align the energy system with a 1.5°C or 2°C goal results in steeper emissions cuts required in future years. These changes can be seen in the evolution of Ambitious Climate policies from IEA over the last several years.
As Figure 18 illustrates, IEA SDS scenarios from recent years for primary energy demand in 2040 reflect the ever-increasing gap between ambition and progress to date. For example, fossil fuel’s share in the 2017 SDS was 61 percent in 2040, compared with 54 percent in the 2021 analysis, with the largest portion of this difference stemming from lower levels of natural gas demand. Inversely, renewables’ share in 2040 was 29 percent in the 2017 SDS compared with 38 percent in the 2021 analysis.
Figure 18. World Primary Energy Demand in Ambitious IEA Scenarios in 2040

Ambitious Climate scenarios, Equinor Rebalance has the lowest amount of CCS in 2050, with 2 billion metric tons (BMT); this is a 50-fold increase from 2020. All other outlooks grow beyond 5 BMT, with IEA NZE reaching 7.6 BMT in 2050 (Figure 19).
Figure 19. Global CCS in 2021 Energy Outlooks and IPCC Scenarios

In the IEA NZE, fuels supply sees the largest use of CCS for the production of low-carbon hydrogen, natural gas, and other fuels. The NZE also has a major role for biomass with CCS, for both primary energy consumption and biofuels productions. By 2050, direct air capture and biofuels production result in nearly 2 BMT of CCS in the NZE and over 1 BMT in IEA SDS.
Shell Sky1.5 envisions a slower ramp-up of CCS than the NZE, relying more heavily on negative emissions from land use change (e.g., afforestation and reforestation). Beyond 2050, Sky1.5 projects an enormous scale-up of biomass, with CCS reaching a peak of 9 BMT in 2080 and helping to reduce global temperatures to the 1.5°C temperature goal by 2100.
The levels of CCS deployment envisioned in these scenarios are considerably lower than some pathways modeled as part of the IPCC’s 2018 report on limiting global temperature rise to 1.5°C.20 Nonetheless, the scale of CCS deployment in these and other modeling efforts exemplifies the magnitude of net-zero technology deployment that is necessitated to close the growing gap between an ambition of 1.5°C and a reality of steadily rising greenhouse gas emissions.
To view the full report, along with data, methods, and references, click here.


