Converting Forests to Solar Facilities: Causes, Potential, and Implications
This report provides a rapid assessment of potential conversions of forests to solar facilities.
1. Introduction
Anticipated growth in renewable energy will substantially curtail the US energy sector’s greenhouse gas emissions but has implications for land-based sectors of the economy. US climate policies and energy markets now provide especially strong incentives for expanding solar photovoltaic (PV) capacity. As a result, conversion of agricultural and forested lands to utility-scale solar facilities has accelerated over the past decade. Energy projections indicate a rapid expansion in the rate of solar development and land use changes, especially where high electricity demand coincides with access to transmission infrastructure. This implies a concentration of effects on ecosystem services. Rising public alarm regarding solar siting, initially focused on agricultural land, portends challenges for land-based sectors and the clean energy transition.
This report provides a rapid assessment of potential conversions of forestland to solar facilities. We evaluate the current land use footprint of solar facilities in the United States and land use conversions to support solar production. We examine the policy structures that currently organize the development of solar capacity and evaluate the potential for future land use change. And we explore the associated economic and ecological implications of changes, social concerns, and emerging policy responses.
Our analysis starts with a survey of the literature on solar land use, compilation of available data, and development of a simple projection model. Because the published literature on forest conversion is sparse, we also sought out experts in state forestry organizations, the land trust community, and the energy sector, and we interviewed them about the scope and scale of forest conversion to solar farms, as well as ways in which stakeholders may be affected. We specifically sought insights into patterns of conversion, data sources, and societal issues (e.g., equity, loss of wildlife habitat). Interviewees also weighed in on emerging policies aimed at mitigating the consequences of solar conversions.
As is the case for land development more broadly, converting forests and native grasslands to solar facilities alters the provision of ecosystem services, ranging from commodities such as timber and carbon storage to public goods related to water quality, species’ habitat, recreation, and aesthetics. Consequences include those that accrue to deforestation in general but also issues specific to solar operations. The spatial concentration of solar development implies an uneven distribution of effects. As well as balancing the provision of renewable energy with loss of valuable ecosystem services, best practices for the design of new facilities need to address local communities’ concerns. At all levels of government, policy is still adapting to the challenges associated with solar-driven land use change.
2. Drivers of Solar Energy Demand
The growth in utility-scale solar facilities is driven by strong existing and anticipated demands for green electricity. Climate policy factors prominently, and federal goals for net-zero emissions by 2050 depend on a transition from fossil fuels to renewable sources of energy, including solar, wind, and hydropower. The Biden administration had set a goal to decarbonize electricity production by 2035. Solar photovoltaics now dominate the renewables portfolio and represent the majority of added electricity capacity in the United States—56 percent in 2023, according to a solar industry update from the Energy Information Administration (EIA). https://www.nrel.gov/docs/fy24osti/88026.pdf (Feldman et al. n.d.). EIA projects that nearly all short-term growth in electricity generation will come from solar facilities, with a 75 percent expansion in solar PV output between 2023 and 2025.
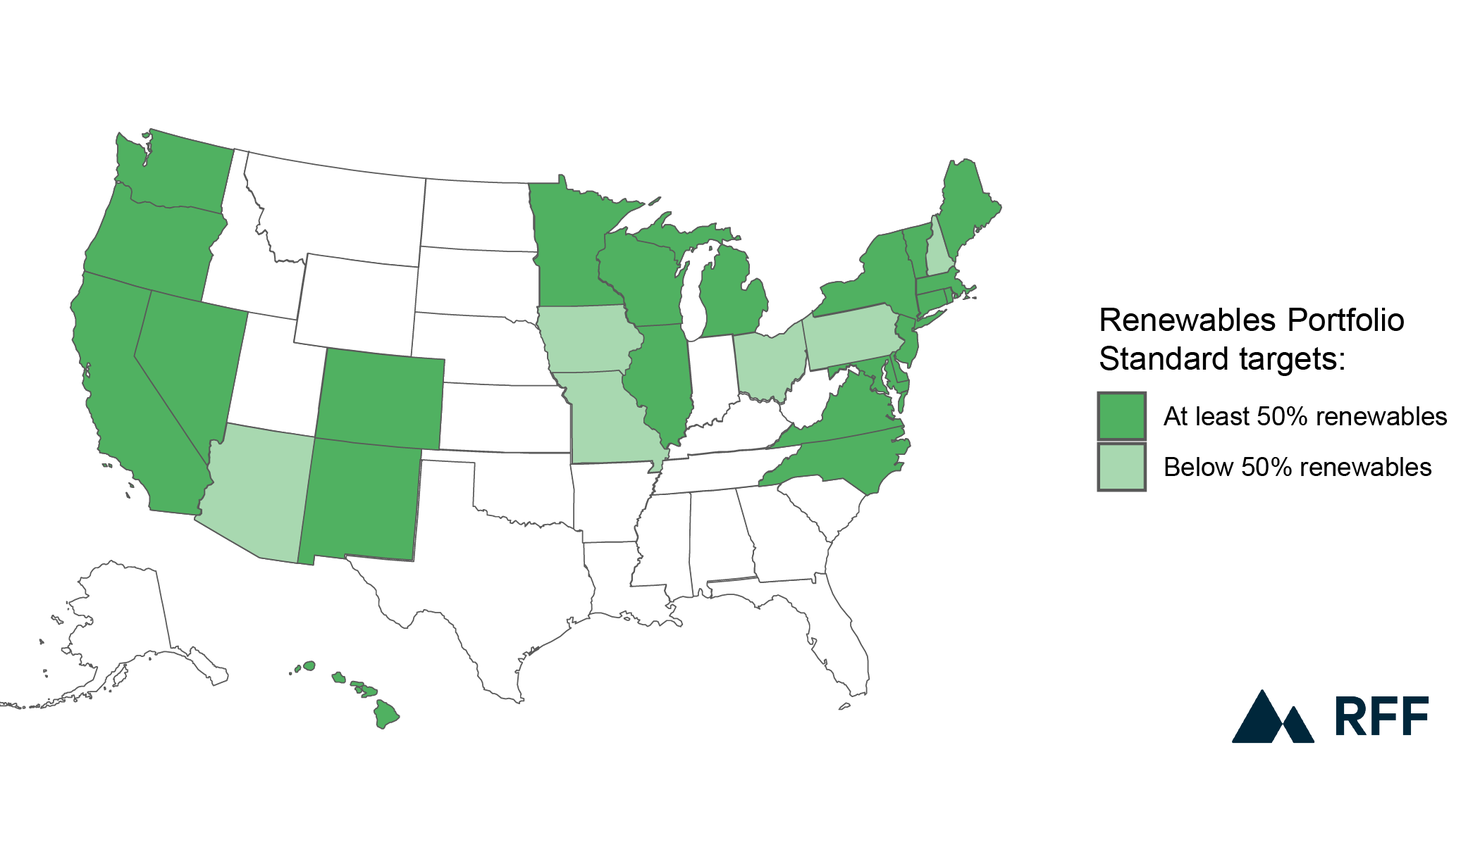
Demand for renewable energy in general and solar in particular arises from both regulations that require utilities to provide a minimum share of electricity from renewables (state-level renewable portfolio standards) and consumer demand for renewable or green energy. https://www.epa.gov/green-power-markets/market-drivers. Evidence from the market exchange of renewable energy credits shows the influence of the two factors to be roughly comparable: in 2022, 56 percent of the credits were produced for compliance markets and 44 percent for the voluntary market (O’Shaughnessy and Sumner 2023). Twenty-eight states plus the District of Columbia have renewable portfolio standards, and 22 states have targets to generate at least 50 percent of electricity sales from renewable sources (Figure 1). “Renewable Portfolio Standards and Clean Energy Standards,” North Carolina Clean Energy Technology Center State-level clean energy standards, which include a slightly different set of resources, also play a role.
Figure 1. States with Renewable Portfolio Standards
Policies beyond renewable portfolio standards strongly influence demand growth. The Public Utility Regulatory Policies Act (PURPA; P.L. 95–617, 92 Stat. 3117, enacted November 9, 1978) provided a critical foundation by allowing nonutility producers to market electricity to the grid. The Inflation Reduction Act (IRA) of 2021 renewed authorization and increased the amount of renewable energy tax credits to further stimulate investment in renewable energy projects. The increased stimulus provided by tax credits may be reduced somewhat by the act’s requirement to use prevailing-wage employees and apprentices. These and other policies play out through fundamental economics of energy choices. Solar has cost advantages over other technologies, and efficiency gains have rapidly reduced the costs of solar PV. The Solar Energy Industries Association (SEIA) reports that the price of installed utility solar capacity dropped roughly 40 percent from $1.74/MWdc in 2014 to $1.03/MWdc in 2024, with comparable declines in cost for commercial and residential installations. https://www.seia.org/solar-industry-research-data. The figures reflect estimates of increased efficiency of panels.
Renewable energy tax credits, initiated 45 years ago, provide especially strong incentives for investments in solar energy production. Recently extended and expanded by the IRA, either production tax credits (PTCs, $26/MWh over 10 years) or investment tax credits (ITCs, 30 percent) can be applied to solar development (Bartlett 2023). These are base values. Substantial bonuses can also accrue to ITC and PTC values—for example, for deployment in an energy community and use of domestically produced components. Gagnon et al. (2023) indicate a strong preference for PTC in utility-scale solar development, especially when accounting for tax equity financing, which allows developers to sell the tax credits to entities with high tax liability. An examination of realized returns to PTC- and ITC-supported renewable investments shows high yields and very limited downside risks, with demand for these investments projected to remain strong throughout the life of the IRA extension (Hunter and Vliet 2023).
The siting of new solar facilities depends on economic variables as influenced by latitude and weather (determining solar insolation) and proximity to transmission infrastructure and demand centers. New demands are driven by population and economic growth, increases in per capita electricity demands associated with electrification of buildings and vehicles, and increases in computing demands, including emerging demands for cryptocurrencies and AI applications. We expect that relative prices of land in existing uses, conversion costs, and the regulatory environment also influence these investment decisions. Where locational factors align, solar leases can outcompete timber or agricultural uses by large margins (see Cooper and Dwivedi 2024). Similar findings have come from other parts of the world; see Farja and Maciejczak (2021).
3. Geographic Patterns of Solar Development and Forest Conversion
As solar PV provides a growing share of electricity at the national scale, utility-scale development is occurring at unprecedented rates in many places. California leads the country in terms of total solar power capacity, thanks to its geographic advantages in solar irradiance metrics and its status as an early adopter of solar PV technology. However, Texas—another large and sunny state—is catching up fast. In terms of utility-scale solar capacity, Texas surpassed California in late 2023, https://www.governing.com/infrastructure/texas-surpasses-california-with-most-installed-solar-power. although California still leads overall because of its extensive deployment of residential and commercial rooftop solar. https://www.citizen.org/news/why-texas-leads-california-in-wind-but-not-solar/. Florida, the nation’s third-largest state by population, had the third-largest total solar capacity in 2023. https://www.consumeraffairs.com/solar-energy/solar-capacity-by-state.html.
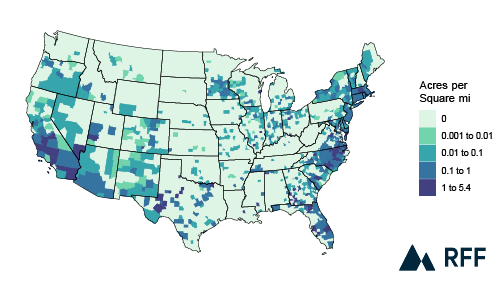
States with smaller land areas and less ideal solar irradiance are also investing heavily in solar PV facilities. North Carolina ranks fourth in total installed solar capacity, and when solar footprint is expressed as a fraction of total land area, many counties in Eastern Seaboard states surpass their western counterparts (Figure 2). Comparison at this level of detail is made possible by the US Photovoltaic Database (USPVDB). A product of the US Geological Survey (USGS) and the Lawrence Berkeley National Lab, this database covers photovoltaic facilities with at least 1 MW of capacity that were built in the United States before 2022 (see Appendix for details).
Figure 2. Fraction of County Area Occupied by Solar Facilities, 2021
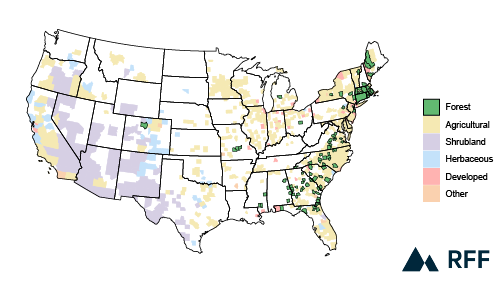
In eastern states, forests coincide with agricultural land near the population centers where electricity demand originates. For this reason, a larger fraction of forestland conversions have taken place in the East than in the West, where solar facilities are often built in more sparsely vegetated shrubland (Figure 3). Conversion of agricultural land is also common. Conversion estimates are derived from the National Land Cover Database (NLCD), This high-resolution raster data set provides information on the extent of developed, agricultural, forested, sparsely vegetated, and other land cover categories across the contiguous United States. a GIS data product of USGS, in addition to the USPVDB. Because each solar installation is labeled by construction date, we can estimate the conversion of all land cover types in each year from 2005 to 2021 (see Appendix for details).
Figure 3. Land-Cover Categories: Greatest Area Converted to Solar, by County, 2021
Until 2015, solar development was concentrated in the West, especially in the three Pacific states (Figure 4). After 2015, solar growth shifted to the Plains and the Southeast. Current capacity is highest in the Pacific and the Southeast. As construction has increased in the East, the area of forest being converted to solar PV facilities has increased substantially (Figure 4). In the Southeast, forest conversions are most expansive in North Carolina, but span from Virginia to Florida, especially in the Coastal Plain and Piedmont subregions. In the Northeast, most forest conversion has taken place in Massachusetts, another state where large areas of forestland coincide with relatively large population centers (Figure 5).
Figure 4. Land-Cover Categories: Annual Area (Acres) Converted to Solar, by Region
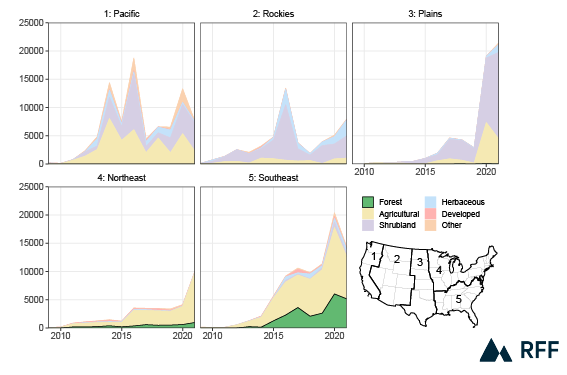
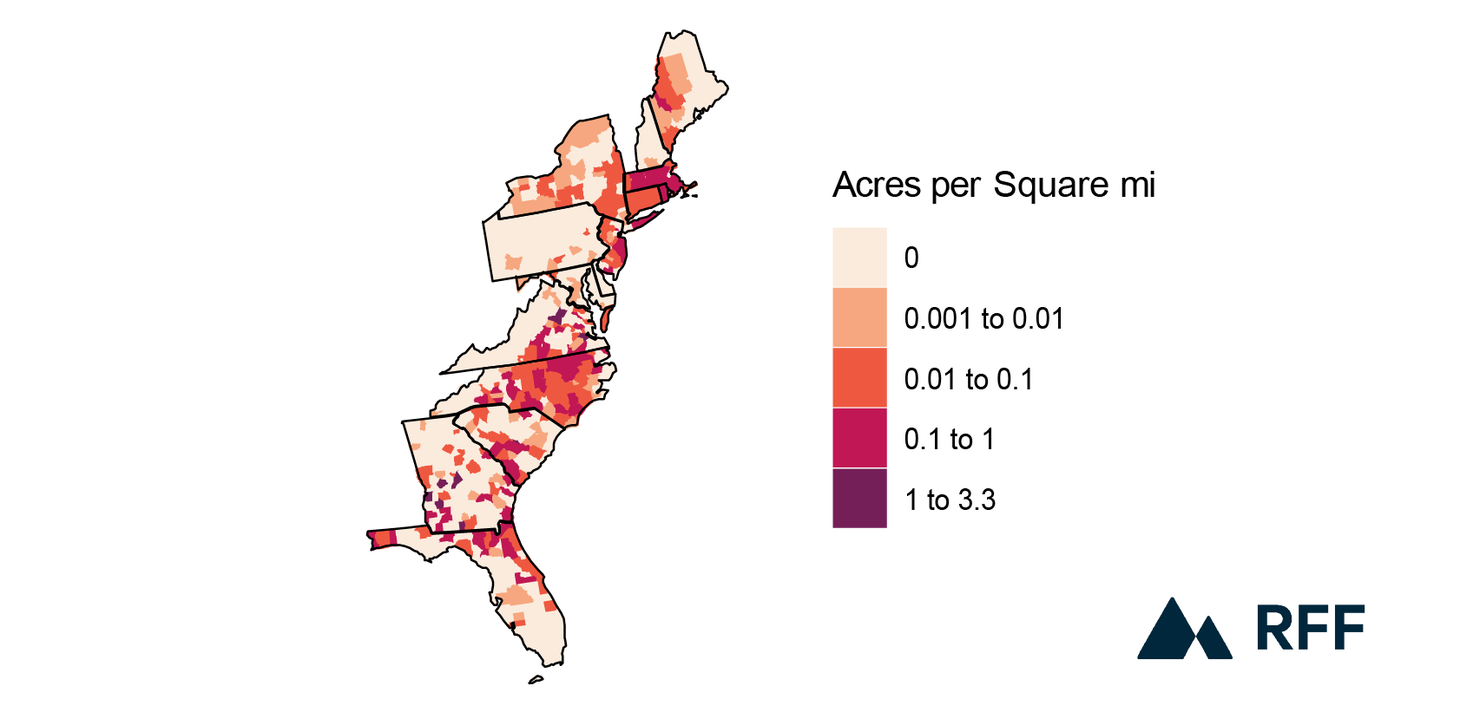
Figure 5. Acres of Forest Conversion in Eastern States, Normalized by County Area, 2021
4. Projecting Solar Development and Land Conversions
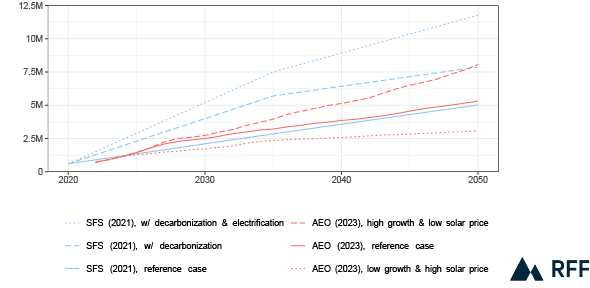
Because solar production capacity and land-area requirements are both closely tied to the area of solar panels exposed to the sun, the efficiency of panels can be used to estimate the land area required per unit of capacity. We predict future land requirements for solar production using the National Renewable Energy Laboratory (NREL) average footprint of 7.5 acres per MWac of installed nameplate capacity and various projections of future solar production capacity. A benchmark study (Ong et al. 2013) defined the power density of utility-scale solar at roughly 8–10 acres/MWdc, but solar PV yields have increased substantially in recent years as the technology has developed. Bolinger and Bolinger (2022) estimate a rough doubling of power density for utility-scale solar arrays from 2011 to 2019 and a revised estimate of 3–4 acres/MWdc. Using estimates from Bolinger and Bolinger (2022) and Walston et al. (2021) to account for the nonarray area in a solar facility, Ardani et al. (2021) apply 7.5 acres per MWac of nameplate capacity. The area footprint for concentrated solar power sites is 10 acres/MWac, but such sites are a very small component of anticipated solar capacity. Capacity projections for three scenarios from NREL’s Solar Futures Study (SFS; Ardani et al. 2021) indicate that solar facilities, which occupied 0.3 million acres in 2021, would occupy 3 million to 7.5 million acres in 2035 and 5 million to 12 million acres in 2050 (Figure 6). Projections using three 2023 scenarios from the Annual Energy Outlook (AEO) are lower, about 3 million to 8 million acres in 2050. We use an inverter loading ratio of 1.3 to convert between AC and DC capacity, as in Ardani et al. (2021) If in Figure 6 we use only the clean energy futures scenarios (SFS Decarbonization, SFS Decarbonization plus Electrification, and AEO High Growth and Low Solar Prices), land requirements would range from 7.5 million to 12 million acres in 2050. USDA analysts have recently conducted a study of the land cover footprint of both utility-scale solar and wind energy using somewhat different methods and data but with highly comparable results (Maguire et al. 2024). See Van de Ven et al. (2021) for solar footprint estimates in the European Union, South Korea, India, and Japan.
Our projections based on technology in 2020 should be considered a preliminary approximation. Considering that the energy efficiency of solar PV has increased by about 40 percent on an area basis since 2011 (Bolinger and Bolinger 2022) and is likely to increase further (Ardani et al. 2021), our projected area requirements likely have an upward bias and are best seen as upper bounds for a given expected power capacity. However, we do not account for the additional land needed for transmission infrastructure and adjacent battery storage in our main analysis. If we assume a total footprint of 10 acres/MWac (an additional 2.5 acres to account for these other uses), solar’s total land use would grow to perhaps 10 million acres in 2035 and 16 million acres in 2050. One estimate of the total land requirements for renewable energy—solar, wind, and transmission combined—is 51,000 km2, or about 12.6 million acres by 2035 (Denholm et al. 2022), which is consistent with our results
Figure 6. Scenarios of Acres Required for Photovoltaic Facilities to Match Projections of Solar Capacity (Based on Current Solar Efficiency)
As shown in Figures 3 and 4, the fraction of land that would come from forests differs substantially from state to state. Predicting future forest conversion requires estimating future projected capacity and forest conversion rates at a resolution sufficient to capture the geographic patterns of both factors. Here, we link state-level solar capacity data for 2024 and projections for 2029 from SEIA with state-level forest conversion rates based on our analysis of USPVDB and NLCD data (see Appendix for details). States with the highest projected near-term solar growth rates are among those with the highest historical forest conversion rates, largely concentrated in the Southeast (Figure 7). These estimates should be considered first approximations because they do not account for how the mix of lands available for conversion would be affected by ongoing land development patterns. For example, as marginal agricultural land is converted to solar, more forests would likely be utilized in the future. However, these projections should be useful for identifying where forest conversions are most likely to occur in the near term. We found that whereas North Carolina underwent the most forest conversion of any state up until 2021, if SEIA projections bear out, Virginia, Florida, Mississippi, and Georgia may surpass it in terms of total forest conversion by 2029.
Figure 7. Projected Forest Conversion to Solar (Cumulative Area, in Acres), by State
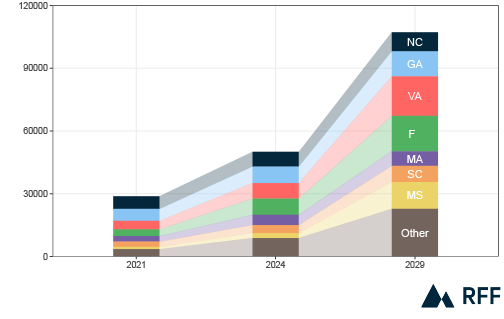
Note: “Other” includes all other states nationwide.
5. Effects in Related Economic Sectors and Nearby Communities
5.1. Implications for Land Markets
Our projections of land requirements for solar facilities under clean energy scenarios (7.5 million to 12 million acres by 2050) implies a national build rate of 242,000 to 373,000 acres per year. According to the National Resource Inventory (2017), the annual rate of urbanization (i.e., conversion of rural land to developed uses) in the United States averaged 614,000 acres between 2007 and 2012, and 525,000 acres between 2012 and 2017. Note that the years 2002–2012 include the great recession that commenced in 2008. The 35-year development average was about 1.2 million acres per year (USDA 2020), but the rate has declined substantially in the most recent 15 years. Assuming that these development rates continue, solar construction would increase the rate of land development by 39 to 71 percent, to a total of 856,000 to 898,000 acres per year, increasing the overall scarcity of rural land and other indirect changes in land use. The magnitude of these effects depends on where development occurs but would likely involve switching between agricultural and forested land uses at the margin, especially in the Southeast, where land use change has been especially dynamic since the 1950s.
Where solar development and housing development coincide, the rates of land use change would be much higher than the national averages, and effects on land scarcity, land prices, and housing prices would be amplified. Eastern Seaboard areas—for example, in Northern Virginia, in Massachusetts, and around Atlanta—may experience these amplified local land use effects.
5.2. Implications for Timber Supply
The spatial distribution of solar development will determine how and to what extent timber supplies would be affected. Timber production is unevenly distributed across the United States, with highest levels of production in the coastal plains of the Atlantic and Gulf of Mexico from Virginia to East Texas, the Appalachian piedmont, and the west side of the Cascade Mountains in Oregon and Washington (Figure 8). Given the vast area of timberland in these regions (more than 200 million acres in the Southeast alone), anticipated loss of forestland would likely have very little discernible effect on overall timber supplies and prices at the regional level. However, the correspondence of high rates of forest conversion with high timber production could make timber scarce in certain areas, with consequences for the local forest products industry. Large areas of correspondence have emerged in the piedmont and coastal plain of North Carolina and adjacent areas of Virginia (Figure 8). Smaller areas of strong correspondence occur in South Carolina, Georgia, and northern peninsular Florida. Projections indicate that the area of intersection between solar development and current timberland could grow in these states. Solar development on intensively managed pine plantations in these areas would have the greatest potential for shifting timber supply.
Figure 8. Intersection of Timber Output and Area of Solar Facilities
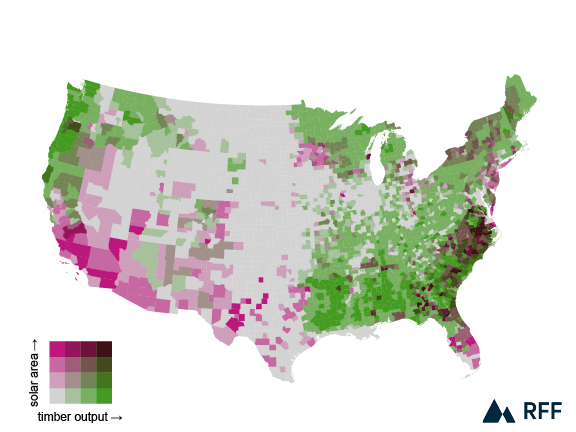
Notes: Solar area categories are based on Figure 2. Timber production categories are based on average annual removal of timber products per unit area. Source: query of US Forest Service’s Forest Inventory and Analysis plot database in January 2024, most recent remeasured inventories.
5.3. Implications for Carbon Sinks and Net Emissions
Both clean energy and forests provide climate benefits, from emissions reductions and net carbon sequestration, respectively, so converting forests to solar facilities involves a trade-off. Compared with fossil fuels, solar and other renewables generate electricity with far fewer greenhouse gas emissions. A scan of the literature indicates that an acre of solar arrays avoids about 185 metric tons of emissions per year. See, for example, https://news.climate.columbia.edu/2022/10/26/solar-panels-reduce-co2-emissions-more-per-acre-than-trees-and-much-more-than-corn-ethanol/. In contrast, the deforestation of an acre of forest along the Eastern Seaboard would result in net emissions of about 54.3 metric tons over a 45-year horizon (Wear and Wibbenmeyer 2023). Wear and Wibbenmeyer (2023) use the Carbon and Land Use Model (CALM) to estimate the carbon emissions resulting from an acre of deforestation for each ecological section of the country. Along the eastern seaboard, this ranges from 48.2 to 61.1 and averages 54.3 t CO2 equivalents per acre, accounting for the transfer of soil carbon from forests to the alternative land use (in this case, to solar facilities). In other words, emissions reductions from solar offset the loss of the carbon sink capacity within the first year of operation and continue to accrue carbon benefits at high rates over the life of the investment. Stern et al. (2023) similarly find that solar PV outperforms afforestation in providing net carbon emissions reductions in arid landscapes.
Another way to compare the implications of deforestation associated with solar development is to examine total sink effects. Using an emissions factor of 54 mt/acre, a hypothetical deforestation of 5 million acres by 2050 (a high upper bound) would result in net emissions of 271.5 million metric tons (MMT) over 45 years. The size of the total forest carbon sink over this period (again based on Wear and Wibbenmeyer 2023) is expected to be 19,869 MMT, so the deforestation would result in a 1.4 percent reduction in the forest carbon sink.
5.4. Implications for Ecosystem Services
As utility-scale solar development grows, public resistance is becoming evident. Although often driven by the loss of forests and grasslands, it is implicitly based on a concern for the loss of natural systems and the services they provide, including wildlife habitat, healthy water systems, recreation, and aesthetics. Effects on these services, unlike for timber and carbon, are highly site-specific and influenced by the amount of forest area, local fauna, and scarcity of water (Nelson et al. 2009; Binder et al. 2017). State-based best management practices (BMPs) were developed to explicitly protect forestland, and forest certification systems include ecological—as well as economic and societal—criteria to ensure forest sustainability. When a forest is converted to a solar farm, it is likely that these attributes are lost or significantly altered. Empirical studies to describe local effects on services are few, but informed extrapolation from other studies on land conversion can point to issues that may emerge. An accounting for the nonmarket values of ecosystem services can articulate the full scope and costs of trade-offs associated with land use conversions (e.g., Lawler et al. 2014; Nelson et al. 2009; Polasky et al. 2011).
The Southern Environmental Law Center has raised concerns about the loss of habitat for the gopher tortoise, an endangered species, in the sand hills region of Georgia, which is also preferred for solar development. Pollinator habitat disturbances, examined in Oregon, are very suggestive of the effects to all trophic levels of land conversion. In Georgia, changes in the local hydrology due to conversion of forestland to solar facilities have diminished water quality and, in at least one case, have led to fines to the polluter. Developers can mitigate some harms through careful design of projects, but unlike forest management practices that are regulated at the state level by BMPs, there seem to be no institutional mechanisms or consistent requirements for solar farm installations beyond local sediment control ordinances.
The “Power of Place” report of The Nature Conservancy (2023) examines potential effects of clean energy development throughout the United States and considers land-saving strategies for minimizing damage. Co-locating renewable infrastructure (e.g., solar and wind generation), emphasizing solar over wind, and siting solar near demand centers are strategies with the potential to reduce the land needed for transmission infrastructure. However, these strategies might come at the expense of forest-based services in the areas closest to population centers, highlighting important trade-offs between protecting remote and intact habitat and providing for scarce ecosystem services (e.g., recreation, aesthetics, water quality, and wildlife habitat) in developed areas. This concern was raised in our discussions with stakeholders in the public sector.
5.5. Implications for Local Economies and Communities
The negative community response to the expansion of forest bioenergy facilities in the South may presage a similar response to land use conversion to solar farms. Some of the concerns regarding bioenergy are focused on the facilities’ pollution, which disproportionately affects disadvantaged communities. https://www.southernenvironment.org/topic/biomass-energy-threatens-southern-forests-and-communities/. In addition, it is unclear whether these communities receive any associated benefits, such as jobs, investment in local businesses, and economic stability. In a case study in California, energy companies, community groups, landowners, tribal members, and the conservation community engaged in a dialogue in 2023 to create a collaborative approach to solar development.
6. Policy Initiatives and Social Dynamics
6.1. Policies That Address Solar Conversions
There is inherent tension between promoting land-based renewable energy projects and converting forests or productive agricultural land as states pursue decarbonization of their energy sectors. Efforts to address land use conversion are currently most active at the state level. For example, recent legislation established the Rhode Island Renewable Ready program, which includes provisions to prevent loss of forestland to solar farms. And in May 2024, Connecticut passed a comprehensive energy bill that laid out terms for the installation and expansion of solar capacity; an explicit consideration of land conversion effects was not included, but a recognition of environmental justice issues was.
Several officials surveyed for this study noted that solar farm siting is often within the purview of local governments, which do not have the regulatory control or necessary resources to assess the environmental effects. To provide state-level consistency, in 2023 the Illinois state legislature passed a bill that limited solar siting by local jurisdictions. A University of Michigan working paper (Essa et al. 2021) looked at this jurisdictional question across the United States and found a range of approaches, from total local control to a hybrid approach also involving the state. Because there are few databases on conversion to solar or other renewables, the cumulative effect is difficult to assess.
Policy at the federal level could either address land conversion or put constraints on renewable energy activities. For agricultural land and forest conversion, the Farm Bill could be a mechanism both to understand the scope of the issue and to implement monitoring methods. Title IX of the Farm Bill has included many provisions supporting or providing guidance on energy policy for landowners. Language has been developed in the most recent House draft and passed through committee in 2024 but has not been taken up by the 119th Congress. In partnership with USDA, the Department of Energy’s Office of Energy Efficiency and Renewal Energy (EERE) could provide guidelines for renewable energy grants that reduce the potential for conversion of productive agricultural land and forests.
Separate from the Farm Bill, standalone legislation is another mechanism to establish criteria for federal investment in solar installations that may result in land use conversions. Rep. Bost (IL) has introduced H.R. 7923, which would limit USDA funding for solar facilities that lead to agricultural land conversion and require the establishment of guidelines to reduce effects on soil health. Although forestland is not explicitly included, this legislation could be a vehicle to expand the land uses covered by the guidance. We note that policies that discourage buildout only on agricultural lands would likely shift more construction to other rural lands and especially to forests in the Northeast and Southeast. Legislation at the national level could also lead to a national standard to better guide companies and communities.
6.2. A Changing Social Dynamic
The acceptance of utility-scale solar facilities by local communities has not been thoroughly studied, so the following assessment is conjectural, based on few studies. Early acceptance of utility-scale solar facilities was in large measure driven by the perceived benefits of moving to renewable energy sources (e.g., Dickerson 2018). Although the footprint of a facility could be large, its generally low profile meant that strategically placed vegetation could hide the facility from view. Many facilities were also being placed on land recently retired from agricultural use or in places where land disturbance was not considered an issue. However, where solar facility siting comes at the expense of forests, forest clearing is leading to a clash in values. A study by researchers In Massachusetts (Manion et al. 2023) points out that the carbon sequestration value of standing forests, as well as the ecosystem services that they embody, should not be compromised by solar facility development without sufficient consideration of the environmental trade-offs. Anecdotally, community protests against land conversion to solar facilities are leading some companies to seek alternative placement options (e.g., built infrastructure). As with other industrial uses of land, there seems to be a tipping point at which local communities and other landowners recognize the societal consequences of a facility.
7. Information Needs for Planning and Policy Analysis
7.1. Data and Monitoring Needs
Through interviews and review of the literature on forest conversion to solar farms, we found a great deal of variability and no standardization in documenting such conversions. The lack of data, and thus trend information, is a barrier to fully understanding the extent of the issue. Our projections are based on existing models, but a more systematic and rigorous approach would be of value. The Forest Inventory and Analysis program of the US Forest Service, implemented in collaboration with the states, could provide the monitoring infrastructure to track land use change caused by solar and other renewables. In some cases, an intensification of the plot design might be warranted, coupled with the use of remote sensing platforms, to produce timely information at the right scale. We note that data compilation protocols may need to be modified to account for transmission infrastructure defined as linear features. Developing tools for high-resolution forest inventory and land use change monitoring is an area of active research and falls within the scope of the research venture called Partnership for Small Area Estimation, involving several research institutions. https://www.ncasifoundation.org/projects/small-area-estimation-partnership/.
Potential partners in this endeavor include the land trust community and NGOs concerned about land conservation and ecosystem services. We note that the agricultural sector has made significant investments in understanding the conversion of agricultural land to solar farms, including through USDA programs. The establishment of state-based BMPs would be a mechanism to reduce the damage of facilities to soil health and water quality. We are not aware of any BMP that addresses solar farm establishment.
7.2. Unknowns
Our initial rapid assessment of the potential for forest conversion and other land use effects related to solar development has used readily available data to inform models based on rudimentary projection methods. In the process, we have identified questions that warrant additional study to support planning and policy discussions about solar farms’ effects on forests:
- What and where are the anticipated future demands for rural land in the clean energy transition, including land for solar facilities and land for transmission and other infrastructure?
- What are the primary and secondary land use changes that could result from the increasing demand for land for energy?
- How and where will anticipated land use changes affect provision of scarce ecological services?
- Are societal perspectives about renewable energy sites changing as land conversions occur, and how does this challenge implementation of clean energy strategies?
Answers to those questions would require fine-grained analysis of the consequences of solar development and land use change to support local assessment and planning.
8. Conclusions
Our rapid assessment of potential conversions of forestland to solar facilities examines the demand drivers for solar and the current land use footprint of solar facilities in the United States, and it projects land use change in response to anticipated growth in solar production. It also explores the potential economic and ecological implications of changes, emerging social concerns, and policy responses. Our overall finding is that anticipated solar development will likely have important but mainly localized effects on land use and the forest sector into the foreseeable future. Our main observations follow.
- Growth in clean energy markets reflects both climate policy and private sector demands. Solar has a strong comparative advantage among renewables and is expected to grow rapidly.
- The location of future solar development will likely be organized by both physical solar insolation—determined by latitude and climate—and economic factors, including proximity to demand centers and access to transmission infrastructure.
- Solar development is shifting from western to eastern states, and a growing portion of conversion is occurring on forestland.
- Utility-scale solar progressed from demonstration to rapid deployment between 2008 and 2018. Solar development is accelerating and will continue to grow into the foreseeable future.
- Rapid and accelerating rates of solar and other renewable energy development indicate a need for real-time monitoring of land use changes and ongoing assessment of effects.
- As much as 7.5 million acres could be required for solar expansion by 2035, and up to 12 million acres by 2050, based on current technology. Increased efficiency could moderate these projections somewhat, but the land area needed for additional transmission infrastructure and battery storage—not addressed in our analysis—could also be substantial. Based on current rates, conversion of forests could constitute about 2 to 5 percent of the total land area converted, but the share of forests will likely increase as the supply of marginal cropland and pastureland falls.
- Projected solar development would increase the overall rate of rural land loss by as much as 71 percent over baseline rates, driving up land values and housing prices and causing indirect land use changes—that is, compensatory land use changes in other locations.
- Regional timber markets are unlikely to be substantially altered by anticipated changes in forest area, but local effects could be important, especially along the part of the Eastern Seaboard of Virginia to Georgia where large areas of conversion coincide with high timber productivity.
- The emissions reductions of solar PV systems far exceed the carbon sequestration benefits from standing forests.
- The loss of forests and grasslands to solar facilities alters wildlife habitat values and landscape hydrology. Where development is concentrated, these effects could be consequential.
- Community opposition to solar developments may parallel that related to bioenergy development, including concerns about social inequality in rural communities.
- Efforts to address land conversion are currently most active at the state level, though some congressional discussions are under way. Emergent policy focuses on regulating siting protocols and protecting prime agricultural land and forests.