Considerations for Washington’s Linkage Negotiations with California and Québec
This report examines the benefits of reducing emissions delays, maximizing program revenue for climate projects, and maintaining affordability in Washington’s cap-and-invest program.
Executive Summary
Washington State is exploring linking its cap-and-invest emissions trading system with the already linked market of California and Québec. To inform the discussions, Resources for the Future analyzed auction allowance revenue and emissions both with and without linkage and studied how the range of outcomes could affect Washington’s environmentally overburdened communities designated as highly impacted by air pollution.
Our analysis found that linkage would lead to greater regional emissions reductions, more regional environmental benefits, and a more affordable program because of the expanded emissions reduction opportunities across the linked jurisdictions. However, assuming no new state policy interventions, Washington’s revenue would be moderately lower and the rate of emissions reductions moderately slower.
As part of its due diligence in exploring linkage, Washington is exploring potential environmental justice consequences and has received a memo from the state’s Environmental Justice Council outlining concerns as well as a set of recommendations for how to mitigate against these concerns. In this report, we look at three of those recommendations:
- limit the use of banked allowances to mitigate the influence of the California-Québec allowance bank on Washington’s allowance revenue and emissions;
- align offset rules to ensure environmental benefits in linked states; and
- implement a facility-specific emissions cap.
Limiting the use of banked allowances would be the least feasible because of financial regulations governing such assets. Aligning the rules for the eligibility and use of offsets across a linked market would require modifying California’s rules and therefore may be difficult to achieve. A facility-specific emissions cap, however, could be implemented independently by Washington, and enforcement could be tailored to align with existing policies. This approach would provide a market-based backstop to support emissions reductions at emitting facilities in environmentally overburdened communities.
We also analyzed effects of an emissions containment reserve and found that it would likely generate more state revenue without sacrificing cost efficiency for covered entities, but only if it is adopted across all linked jurisdictions. That and other programmatic and policy adjustments could help preserve revenues and ensure that the emissions reductions in environmentally overburdened communities meet or exceed the state’s average facility-level emissions reduction rate.
1. Introduction
To inform Washington’s cap-and-invest linkage conversations with California and Québec, Resources for the Future analyzed whether a linked program would improve the efficiency of both the Washington and the California-Québec markets while centering environmental justice and equity.
Linking of state and other subnational carbon markets offers efficiency gains in the form of more stable allowance prices, reduced risk of leakage, reduced risk of migration by emissions-intensive trade-exposed (EITE) industries, improved cost-effectiveness for participating industries, and expanded participation (Burtraw et al. 2013; Ranson 2017). Linkage also sends a policy signal to other jurisdictions and to federal governments. These benefits enable more aggressive climate policy within the emissions trading framework and complementary policies, such as low-carbon fuel standards. However, because linking of markets expands the geographic scope in which companies may reduce emissions to comply with state regulations, it may impede the ability of individual jurisdictions to ensure that emissions reductions and associated environmental co-benefits, such as improvements to air quality, are achieved in environmentally overburdened communities.
Interstate cooperation through linked carbon market programs, such as the Regional Greenhouse Gas Initiative (RGGI), and linked energy systems, such as regional transmission organizations (RTOs), is known to be an important force for collaboration and policy learnings, which can advance ambition (Bell and Mallinson 2021; Carley and Nicholson-Crotty 2018; Stafford and Wilson 2016). However, accrual of health, environmental, and economic benefits to overburdened communities at a rate that equals or exceeds that for the state or linked areas as a whole is not guaranteed and remains elusive when climate policy does not make it an explicit goal (Fowlie et al. 2020; Pastor et al. 2022). Targeted market mechanisms, complementary policies, and greater community oversight over investment of revenue may improve environmental justice and equity outcomes for carbon market programs, particularly by achieving the efficiency gains and stability that come from linking with other markets.
Linkage discussions between Washington, California, and Québec began against the backdrop of a referendum threat to Washington’s cap-and-invest program. The referendum was partly a response to the initially high allowance prices experienced in Washington, compared with other US emissions trading system prices. After Proposition 2117—a ballot initiative to cancel the cap-and-invest program and repeal its authorizing legislation—was introduced, Washington’s allowance price dropped to a near all-time low, hovering near the price floor throughout 2024. Proposition 2117 was defeated, however, and allowance prices in the secondary market rebounded.
A critical rulemaking process for California’s cap-and-trade program is expected to culminate in new emission caps, free allocation rules, price control mechanisms, and environmental justice commitments (Roy et al. 2024). The rulemaking process and potential linkage are an opportunity for California to learn from innovations in Washington’s carbon market design, thereby improving price stability, affordability, environmental justice, and revenue outcomes across all linked markets.
This report looks at how benefits can accrue more equitably in Washington under a linked cap-and-invest program. For the purposes of this report, equitability is defined as minimizing delays in emissions reductions in overburdened communities and optimizing program revenue for investment in climate and air quality projects while maintaining affordability. The report covers the following topics:
- a review of Washington’s designation of overburdened community highly impacted by air pollution, air pollution sources, and correlations of stationary source criteria air pollutants and greenhouse gas emissions;
- lessons learned from past market linkages and novel considerations in the Washington-California linkage;
- model results on the range of possible outcomes for allowance prices, emissions reductions, and revenues for both states, both with and without linkage; and
- market design mechanisms tailored to Washington and California that could help ensure environmental justice outcomes under a linked program.
Providing long-term price and political stability for Washington’s cap-and-invest program is important but need not eclipse thoughtful consideration of mechanisms to achieve local environmental and economic benefits. Including in the linked program mechanisms that will deliver benefits in targeted communities will help Washington ensure environmental justice and equitable outcomes for its residents.
2. Regulatory Background: Environmental Justice in Washington’s Cap-and-Invest Program
Washington’s Climate Commitment Act (CCA), which was voted into law in 2021 and took effect in January 2023, places a statewide emissions cap on 75 percent of emissions and establishes a cap-and-invest carbon market intended to help businesses find the most efficient path to reducing carbon emissions. Market revenues are to be invested in environmental and health improvements, emissions reduction programs for hard-to-abate sectors, and climate resiliency efforts.
The CCA prioritizes environmental justice considerations through three primary mechanisms:
- Environmental Justice Council oversight: improving community input and oversight in program design and revenue allocations.
- Air quality improvements in overburdened communities: identifying environmentally overburdened communities highly impacted by air pollution and measurably reducing criteria air pollution in these areas.
- Revenue investments: using large shares of the revenue from allowance auctions to reduce health and environmental disparities among vulnerable populations in overburdened communities.
By designing its program to emphasize benefits to overburdened and low-income communities affected by air pollution, Washington will become an international leader in the use of carbon pricing to advance environmental justice objectives.
An additional component of environmental justice in carbon market design is affordability for residents. Affordability has been identified by the California Independent Emissions Market Advisory Committee and the California Environmental Justice Advisory Committee as an important concern (Roy and Burtraw 2024). For ratepayers, affordability of carbon markets correlates to allowance prices because in some sectors, the costs associated with emissions reductions are passed through to consumers (Cludius et al. 2020; Dagoumas and Polemis 2020). Mechanisms discussed here therefore focus on opportunities to encourage market efficiency to maintain overall program affordability while protecting against price volatility.
2.1. Community Engagement in Decisionmaking and Implementation
Washington’s 2021 Healthy Environment for All (HEAL) Act established a coordinated state agency approach to environmental justice, the Environmental Justice Council. Comprising 16 members appointed by the governor, the council advises the state and an interagency working group on environmental justice considerations.
The CCA requires that agencies allocating allowance auction revenue annually report these investments to the Environmental Justice Council and consider its feedback in future allocations. The CCA additionally requires that the Department of Ecology work with overburdened communities and vulnerable populations to identify significant pollution emitters and develop monitoring and evaluation plans for high-polluting sources. The Department of Ecology was also granted the authority to establish stronger air quality standards in the designated overburdened communities highly impacted by air pollution.
Tribal Government Consultation
The CCA established a government-to-government relationship structure between Indian Tribes and state agencies. All agencies covered under the CCA are required to make “reasonable efforts” to collaborate with Indian Tribes in developing and implementing policies, agreements, and programs that directly affect Tribes and to develop a consultation process for issues involving specific Tribes. It further calls for the designation of a Tribal liaison who will report to the head of each covered agency and requires that each department submit an annual report to the governor on Tribal consultations, collaborations, and specific issues. The CCA also requires covered agencies to consult Tribes on allocation of funds that may affect those Tribes, and to develop a consultation framework in coordination with Tribal governments that includes best practices, protocols for communication, and collaboration.
2.2. Selection of Overburdened Communities Highly Impacted by Air Pollution
Criteria air pollutants, particularly fine particulate matter (PM2.5), sulfur dioxide (SO2), and nitrogen oxides (NOx), are often co-pollutants with greenhouse gas emissions. Sources of such pollution “are often concentrated in overburdened communities because of environmental racism” (Department of Ecology 2023, 35). Carbon market policies that regulate greenhouse gas emissions in aggregate for a region or state rather than at the facility level could mean that some emitters maintain or even increase pollutant levels while others decrease them, resulting in uneven local air quality. To ensure that an allowance-based approach to emissions reductions does not worsen air quality disparities, the CCA requires special designation of overburdened communities that are found to be highly impacted by air pollution, with requirements for measurable air quality improvements in these communities.
In 2023, the Department of Ecology designated some of the state’s overburdened communities through a filtering process that used community indicators, such as the state’s Environmental Health Disparities index, the Environmental Protection Agency (EPA) EJScreen mapping tool for disadvantaged communities, and Tribal lands. Figure 1 shows communities qualifying under these criteria. To be defined as overburdened and highly impacted by air pollution (which is a subset of the broader definition of overburdened communities used in Washington), a community must meet certain thresholds under the community indicators and score high on an index for historical air quality indicators, based on monitoring, modeling, and emissions data. Through this process, 16 areas, shown in black in Figure 1, were designated as overburdened and highly impacted by criteria air pollution. These areas account for about 15.5 percent of Washington’s population. Population estimates as of March 2023, as reported in the Department of Ecology’s “Improving Air Quality in Overburdened Communities Highly Impacted by Air Pollution.” This is the first published review of Washington’s Air Quality Program work in designated overburdened communities. Nearly one-third (49 of 166) of the facilities required to report greenhouse gas emissions are located within three miles of a designated area. In the black shaded regions of Figure 1, you can see that the 16 communities designated as ‘environmentally overburdened and highly impacted by air quality’ are a small portion of the areas that meet other state criteria for environmentally overburdened.
Figure 1. Washington’s 16 Overburdened Communities Highly Impacted by Air Pollution and Other Overburdened Community Indicators

Source: Department of Ecology
2.3. Air Quality Improvement Requirements
Activities required by the CCA to reduce air pollution in the overburdened communities highly impacted by air pollution include the following:
- Starting in 2023 and then every two years, the Department of Ecology must perform air quality and greenhouse gas emissions analysis, including health effects from pollution. The assessment can be conducted jointly with the Department of Health.
- The Department of Ecology must work with local air pollution authorities on the following:
- Establish air quality targets that are either consistent with EPA’s national ambient air quality standards or on a par with neighboring communities that are not overburdened, whichever target is more stringent.
- Identify the stationary and mobile sources that are biggest polluters (either increasing emissions or not reducing them).
- Adopt, along with local air pollution control authorities, stricter air quality standards, emissions standards, or emissions limitations on criteria pollutants, consistent with the authority of the department, and consider alternative mitigation actions that would reduce criteria pollutants by similar amounts.
- Ensure an enforceable order by the department or local control authority, which must be implemented within six months.
2.3.1. Sources of Air Pollution in Washington
Washington monitors ambient air pollution to ensure compliance with EPA’s ambient air quality standards for criteria air pollutants—nitrogen oxides (NOx), sulfur dioxide (SO2), particulate matter (PM10), fine particulate matter (PM2.5), carbon monoxide (CO), ground-level ozone (O3), and lead—as well as volatile organic compounds (VOCs), such as ammonia (NH3). All are known to be harmful to human health.
Motor vehicles are the greatest source of air pollution in Washington, constituting about 40 percent of the state’s overall emissions. The state’s 2020 Motor Vehicle Emission Standards law directed the Department of Ecology to adopt California’s vehicle emissions standards, bringing the two states into alignment. The department’s 2023 biannual air quality review for overburdened communities highly impacted by air pollution found that fine particulate matter was the pollutant of greatest concern, with wildfire smoke accounting for the largest share (39 percent) of statewide PM2.5. Cumulative criteria air pollution exposure was also found to be a significant concern in 11 of the 16 overburdened communities.
Figure 2 shows the heterogeneity in primary air pollution sources by county across Washington, and Figure 3 shows criteria air pollutants emitted by sector, revealing the need for tailored strategies to achieve community-level pollution reductions.
Figure 2. Primary Sources of Major Pollutants, by County

Ground-level ozone is the second most significant criteria pollutant across Washington, but ozone is not represented here because it is not included in Washington’s Comprehensive Emissions Inventory. Energy use in buildings, agricultural production, and industrial facilities are contributors to greenhouse gas emissions and are likely to also affect air quality in the state. In 2023, hydroelectric power accounted for about 60 percent of Washington’s total electricity net generation, with a mix of natural gas, nuclear, solar, and biomass accounting for the remainder (EIA 2024), creating a relatively low pollution profile for the electricity sector.
Figure 3. Emissions of Criteria Air Pollutants, by Sector

2.4. Washington Cap-and-Invest Revenue Allocation
Emissions allowances are distributed in two ways in the Washington market: (1) state-owned allowances that are sold at auction to account for emissions from entities covered by the CCA; and (2) free (no-cost) allowances that are allocated to utilities and to entities determined to be energy intensive and trade exposed (EITE). California similarly allocates allowances through the same two primary mechanisms: direct free allocation to regulated entities and sale at auction to all market participants.
Free allocation of allowances in Washington is established by law in the CCA and is designed to protect utility customers from potential cost burdens associated with emission reductions and to allow EITE industries time to identify cost-effective emissions reductions. Electric utilities that consign their allowances to quarterly auction are required to use the proceeds to benefit utility customers, with priority given to mitigating any rate increases for low-income customers. The percentage of freely allocated allowances will decline over time.
Figure 4 shows the distribution of allowances for Washington and California in 2024. The freely allocated allowances (grey) can be used for compliance, consigned at auction, or sold on the secondary market. State revenues are subject to legislative mandates that require appropriations for specific purposes. Both states split the allocation of the cap nearly evenly across the two categories.
Figure 4. Allocation of Allowances, by State, 2024

Sources: CARB and Washington Department of Ecology
Investment of Washington’s cap-and-invest revenue, which has totaled more than $2 billion since the program took effect, must adhere to the following statutory principles:
- Benefits and programs should be based on policy priorities and targeted to vulnerable populations and overburdened communities to reduce statewide disparities.
- Investments and benefits should be made roughly proportional to the health disparities that a community experiences, with a goal of eliminating the disparities.
- Investments and programs should focus on creating environmental benefits, including eliminating health burdens, creating community and population resilience, and raising the quality of life.
- Efforts should be made to balance investments and benefits across the state and within counties, local jurisdictions, and unincorporated areas as appropriate to reduce disparities by location; these efforts should help reduce disparities based on race or ethnicity, socioeconomic status, or other factors.
The CCA prescribes that “a minimum of 35% and a goal of 40% of total investments [must] provide direct and meaningful benefits to vulnerable populations within the boundaries of overburdened communities...with at least 10 percent of total investments that are used for programs, activities, or projects formally supported by a resolution of an Indian tribe, with priority given to otherwise qualifying projects directly administered or proposed by an Indian tribe.” (Revised Code of Washington § 70A.65.230(1)). The relevant section of Washington’s Climate Commitment Act that established the cap-and-invest program was codified into law as Chapter 70A.65 of the Revised Code of Washington, “Greenhouse Gas Emissions – Cap-and-Invest Program” pursuant to passage by the state’s legislature. Text of the code is available at https://app.leg.wa.gov/RCW/default.aspx?cite=70A.65&full=true&pdf=true. The CCA also carves out direct support for Tribes—namely, at least $50 million biennially (every two years)—for activities supporting mitigation and adaptation to the effects of climate change, including capital investments to support relocation of Tribes in areas at heightened risk due to anticipated sea-level rise, flooding, or other disturbances caused by climate change.
The CCA further calls for biennially appropriating $5 million of the auction allowance revenue for activities under the Tribal carbon offset assistance program. Assistance can include funding or consultation for federally recognized Tribal governments to assess a project’s technical feasibility, investment requirements, development and operational costs, expected returns, administrative and legal hurdles, and project risks and pitfalls.
2.5. Lessons from Linked Carbon Markets
Carbon markets have been linked in three ways: (1) at the outset of a regional market’s design, such as with the Regional Greenhouse Gas Initiative (RGGI) and the European Union Emission Trading System (EU ETS); (2) through incremental expansion, with the addition of new jurisdictions, as has occurred in RGGI; and (3) between jurisdictions that have existing programs, such as the linkage between California and Québec and between the Swiss ETS and the EU ETS.
Linkage affects many aspects of markets: the sectors that must comply with emissions reduction requirements, the treatment of offset credits, the treatment of EITEs, the allocation of free allowances, and the design and frequency of auctions. Alignment of policies on copollutant regulations, equitable outcome goals, and use of revenue can build public and legislative support for linkage.
Linkage not only provides efficiency and stability for new or small programs but can also be an opportunity for older programs to update their designs and adopt the innovations of more recent programs. It is therefore an important tool for diffusion of policy innovation and improvement. Here we consider the lessons learned from prior experience with linkage.
2.5.1. California-Québec
When Québec linked its nascent program with California’s in 2014, the effect on allowance prices was asymmetrical: the allowance price remained stable for California but fell for Québec. This was viewed as a positive outcome because it increased market efficiency for Québec’s covered entities and improved political stability and support for the program. A broader environmental benefit also ensued: after linkage, Québec replicated California’s low-carbon transportation policies that promote electric vehicles (Purdon et al. 2021).
In interviews with Québec policymakers and stakeholders involved in the cap-and-trade market design and linkage negotiations, cost containment was identified as the major metric for success (Clean Energy Canada 2015). This was achieved through a floor price and an allowance reserve, which together established a price corridor, and the linkage with California’s market. A notable feature of Québec’s cap-and-trade program is that free allowances are allotted to qualifying entities in two phases: two-thirds upfront and one-third at the end of the compliance period, after real emissions are known. This helps adjust for changes in production and avoids overallocation.
California’s approach to free allocation involves an update based on changes in production. This “output-based allocation” is implemented with an ex post “true-up” to address potential under- or overallocation. The different approaches have not been an issue and are unlikely to affect linking with Washington.
2.5.2. European Union Emissions Trading System
The EU ETS, the single carbon market for the European Union, was formed under existing EU interjurisdictional governance and has expanded as the EU has taken in new members. Since its introduction in 2005, emissions in the covered electricity and industrial sectors have fallen by more than 40 percent (European Commission 2021). Though not EU members, Norway, Iceland, and Liechtenstein joined the EU ETS in 2008 through their membership in the European Economic Area.
The EU ETS has experienced significant price volatility from unrelated factors, including large allocations of free allowances in its early phases, the financial crisis of 2009, the COVID pandemic, and market shocks from geopolitical conflict. Recent research on conditions affecting allowance prices found that private sector confidence in the durability of international climate policy commitments and carbon markets was a critical driver of clean energy investment (Sitarz et al. 2024). The Market Stability Reserve, a mechanism to control allowance supply, along with a tightening of the cap, shaped price expectations and increased revenue generation. The reserve, which took effect in 2019, adjusts the supply of allowances available each year based on the total number of allowances in circulation. It was designed to reduce the surplus of allowances held in private accounts, henceforth referred to as the private bank. Since 2018, prices have risen 10-fold, reaching an all-time high in 2023.
In 2020, Switzerland, which belongs to neither the EU nor the European Economic Area, linked its carbon market with the EU ETS in the world’s first international treaty to link carbon markets. The two markets did not merge into one auction platform, however; instead, a secure electronic link between the two registries enables transfer of emissions allowances. EU member states are authorized to use independent auction platforms. Covered entities are allowed to use allowances purchased in any authorized jurisdictional auction to meet either Swiss or EU emissions reduction requirements. Figure 5 plots price changes over time and shows that allowance prices have moved in harmony since the EU ETS–Swiss linkage.
Figure 5. Allowance Prices in Carbon Markets, 2015–2023
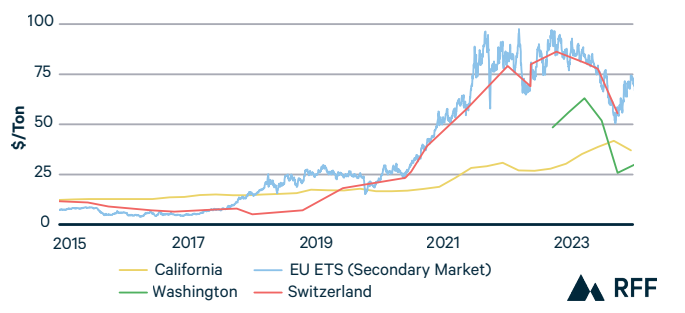
Linkage resulted in increased ambition for Swiss climate policies: as a condition of linkage, Switzerland included fossil-thermal power generation and aviation between EU member countries and the United Kingdom in its covered sectors (Swiss Federal Office for the Environment 2024). But linked systems can also accommodate differences. For example, Switzerland allows carbon sink credits to be used for compliance whereas the EU does not (Rutherford 2014).
A salient lesson from the long-running EU ETS is that forces outside the control of governing bodies can affect allowance prices, but that market-based price control mechanisms can ensure price stability and prevent reactive volatility in the market.
2.5.3. Regional Greenhouse Gas Initiative (RGGI)
RGGI is a cooperative cap-and-trade program that took effect in 2009 and covers emissions from the electricity sector in eastern US states. The 10 original states have cut power sector emissions by 50 percent and raised more than $7 billion for investments in local communities. From the RGGI Fact Sheet, January 2024. Available online at https://www.rggi.org/sites/default/files/Uploads/Fact%20Sheets/RGGI_101_Factsheet.pdf. The 10 original members of RGGI are Connecticut, Delaware, Maine, Maryland, Massachusetts, New Hampshire, New Jersey, New York, Rhode Island, and Vermont.
RGGI has been open to new participants, and membership has changed: New Jersey, one of the original states, withdrew and then rejoined and Virginia joined. Most significant is the anticipated participation of Pennsylvania.
Pennsylvania ranks fourth in the country for state carbon dioxide emissions (as of 2022) and is the second-largest net supplier of electricity to other states (EIA 2022). Prior to 2022, Pennsylvania’s only statewide requirement for emission reductions in the power sector was the 2004 Alternative Energy Portfolio Standard, which required a transition over a 15-year period (from 2004 to 2021) to clean energy sources for 8 percent or 10 percent (depending on the resource type) of a utility’s energy mix.
Pennsylvania joined RGGI in 2022 by executive order of the governor and was expected to reduce its annual average power sector CO2 emissions by 40 percent from 2022 to 2030, with associated annual emissions falling by 79, 68, and 76 percent for SO2, NO2 and PM2.5 emissions, respectively. However, the Pennsylvania Supreme Court ruled in 2024 that the governor did not have authority to enter the state into an interstate cap-and-trade program, thereby freezing participation until a court review, expected in 2025, is completed. If Pennsylvania joins RGGI, the reduction in copollutants is expected to deliver cumulative health cobenefits of $17.7 billion to $40.8 billion (Yang et al. 2021) for the state. Analysis by RFF in 2022 found that by joining RGGI, Pennsylvania would reduce its electricity sector emissions 84 percent by 2030 over 2020 levels at low marginal cost while generating an estimated $101 million to $148 million annually from the sale of emissions allowances (Burtraw et al. 2023). Without cap-and-trade, market forces would likely reduce emissions in Pennsylvania as coal becomes less cost competitive with other energy sources, but at a slower rate, and the state would not gain allowance revenue to invest in local communities.
RGGI is an example of how interstate cap-and-trade programs that take new members can increase regional climate ambition.
2.6. Novel Considerations for Washington-California Linkage
In many ways, Washington and California-Québec are well suited for linkage. Washington’s explicit consideration of linkage in the design of its cap-and-invest program ensured programmatic similarities, such as which sectors are covered, the use of an allowance price containment reserve (APCR), and membership in the Western Climate Initiative auction platform. The states’ complementary policies, such as the low carbon fuel standard, are also in alignment. Washington’s cap- and-invest program is novel in some of its commitments to environmental benefits in disadvantaged communities. These commitments represent new metrics for success in linkage.
The California Global Warming Solutions Act of 2006 (AB 32) convened the Environmental Justice Advisory Committee to advise the California Air Resources Board (CARB) on achieving its emissions reduction goals. CARB was granted authority to implement a market, which then became a pillar of the state’s greenhouse gas policy framework. As the carbon market took shape, the legislature in 2012 implemented a requirement (SB 535) that 10 percent of proceeds from the carbon market go to investments directly in disadvantaged communities and 25 percent go to projects that benefit disadvantaged communities. In 2016 this metric was strengthened, with a requirement (AB 1550) that a minimum of 25 percent of auction revenues be directed to investments in disadvantaged communities, and 35 percent directly benefit those communities. CARB estimates that more than 75 percent of auction revenues to date have satisfied this criterion.
Table 1. Environmental Justice Requirements, by Carbon Market Program

In parallel to implementation of the cap-and-trade program, California in 2017 adopted legislation (AB 617) to shape regulation and steer resources to reduce air pollution in disadvantaged communities. AB 617 requires CARB and air quality districts to implement five activities in disadvantaged communities: community-level air monitoring, community-specific emissions reduction plans, enhanced emissions reporting requirements, accelerated review of retrofit pollution-control technologies on covered industrial facilities, and increased penalties for polluters. CARB was also given authority to direct additional funds to communities determined to have the worst air pollution.
Though Washington and California share state-level commitments to environmental justice and have similar structures to achieve these commitments (e.g., environmental justice advisory councils that inform policy and state investments), Washington presents new considerations for linkage by making air quality improvements in overburdened communities a part of its authorizing statute for the cap-and-invest program. Its commitments expand linkage considerations from overall emissions reductions and revenue generation to include community-level outcomes.
How emissions reductions may shift between Washington and California depends on economy-wide trends as well as sectoral, and in some cases facility-level, scenarios. Research outside the scope of this project that may give the Department of Ecology further insights into the consequences of linkage for environmental justice includes how shifts in emissions profiles at individual facilities may affect air pollution in surrounding communities, and how shifts in revenue from allowance auctions may affect funding for environmental improvements.
3. Modeling the Market Effects of Linkage
Linking Washington with the California-Québec carbon market can stabilize prices, reduce program volatility, and give covered entities access to lowest-cost options for emissions reductions. However, linkage can also produce asymmetrical results in allowance prices, overall revenue, and emissions reductions. A jurisdiction that offers cheaper opportunities for emissions reductions can become a net exporter of emissions allowances to more expensive jurisdictions (Flachsland et al. 2009). Greater cost-effectiveness through linking can raise programs’ ambition, yielding greater overall emissions reductions than if each jurisdiction were acting independently. Again, however, asymmetrical flow of allowances and pricing effects can shift emissions reductions (and thus revenue and environmental benefits) from one jurisdiction to another (Woerman 2023).
To understand the potential asymmetries, we use economic modeling to develop quantitative intuition on the effects of linkage. In setting climate change mitigation goals, states often rely on modeling tools to plan emissions pathways and identify technological needs. Models help ground climate ambitions within mathematical realities and show feasible pathways to the goals. In Washington, the Biennial State Energy Strategy serves this role, providing a roadmap for electrification and decarbonization. In 2021, detailed analysis of how the state will reduce emissions to meet its targets was laid out by the Washington Department of Commerce. In 2023 Washington published its biennial update to the State Energy Strategy. Our analysis uses spreadsheet data from 2021 because of their quantitative detail. CARB conducts a scoping plan process every five years (most recently in 2022) to guide policy decisions on climate, including the emissions trading program.
We use the Haiku emissions market model (Roy et al. 2024), which combines an electric power sector model with elasticities for emissions abatement from the Goulder-Hafstead E3 general equilibrium model and electrification elasticities derived from the aforementioned state modeling exercises. A limitation of the Haiku emissions market model is its exclusion of Québec. However, California is a much larger market than either Québec or Washington and therefore is more important for Washington to consider.
We use Washington’s and California’s published plans for emissions abatement to represent demand for emissions allowances, and we use the programs’ schedule for emissions allowances to represent supply. The model finds the least-cost option for additional abatement beyond these plans driven by the emissions trading systems to calculate equilibrium prices, revenues, and emissions. We can then analyze how the merging of supply and demand from the two markets shifts equilibrium outcomes between the two states and assess market design mechanisms that can maintain revenues and support price stability.
Washington state has already commissioned economic modeling for some potential scenarios of linkage, but its analysis differs in a few important ways. First, it assumes prices from California and Québec; since California’s market is many times the size of Washington’s, we model prices in both California and Washington to assess the effects of linking. Second, the state-commissioned study solves for single-year equilibria; our model solves a perfect foresight optimization, which generates a Hotelling price path to price reserves when a bank is present. Third, besides prices and emissions, our report includes two additional outputs: an evaluation of revenues and an analysis of activating Washington’s emissions containment reserve.
To account for uncertainty about implementation of Washington’s state energy strategy and California’s scoping plan, we use two allowance demand scenarios for the carbon market.
The low allowance demand scenario (i.e., lower prices and lower emissions) represents a lower bound of emissions allowance demand with full implementation of the states’ decarbonization strategies. For this low allowance demand scenario, we also include the behavior adjustment from the Washington State Energy Strategy in the transportation sector. The high allowance demand scenario (i.e., higher prices and higher emissions) assumes a higher emissions pathway from those illustrated in the state-sponsored modeling. We parametrically delay electrification of buildings by three years, increase electricity demand from data centers, delay California refineries’ implementation of carbon capture and sequestration by three years, and assume unchanged behavior in the transportation sector (i.e., no change in vehicle miles traveled from the baseline projection). This high allowance demand scenario is the upper bound of emissions in our analysis. For both scenarios, we allow the model to find an equilibrium in the carbon market through emissions abatement, changes in demand for emissions allowances, and dynamic supply mechanisms. We use the model outputs to illustrate effects on Washington’s cap-and-invest program for allowance prices, revenues, emissions, and other market outcomes.
Throughout, we show a range of outcomes between the low and high emissions allowance demand scenarios. Washington, “the Evergreen State,” is depicted in green; California, “the Golden State,” appears in yellow; and the Pacific jurisdictions of the linked market are in blue.
3.1. Allowance Prices
The allowance price in an emissions trading program is the market price of a permit to emit one ton of CO2. The price is identified in allowance auctions and through subsequent trading in secondary markets. The price reflects market participants’ information about the current and future marginal cost of abatement and future allowance demand, and the desire to hedge against future outcomes in the market. Our model is built on an optimization framework that considers cumulative supply of allowances in the program and finds the least-cost compliance pathway for the entire market. This means that there is no representation of speculation, anticipation of future regulations or linkage, program credibility, political threats to the program, or market psychology. Rather, allowance prices are considered to be set entirely by abatement costs and allowance supply.
Figure 6 presents prices from the unlinked Washington and California carbon markets (left) and prices in a linked market (right). These prices affect the activation of dynamic supply mechanisms, such as the price ceiling, which have greenhouse gas consequences. The triggers for additional allowances (the dotted lines labeled “Price Steps”) include the price floor, the price ceiling, and the allowance price containment reserve (APCR) between them. In both California and Washington, the price steps increase by 5 percent annually in real terms (i.e., after accounting for inflation). Historical prices from both programs are shown up to 2025. After 2025, we show projected prices from our model. All historical prices are in inflation-adjusted 2024 USD and projected in real 2024 USD.
Washington has a narrow range of prices as the price climbs to the APCR before 2030 in both the low and high allowance demand scenarios. The price climbs to the price ceiling by 2032 in the low allowance demand scenario, illustrated by the lower border of the range of prices. In the high allowance demand scenario, the price reaches the price ceiling by 2028. In contrast, California has a broader range of prices in the future; in the high allowance demand scenario, prices reach only the first APCR tier by 2044, and the low allowance demand scenario would lead to prices at the price floor.
Figure 6. Allowance Price Effects, with and without Linkage, 2015–2045

The difference in price ranges between California and Washington arise from Washington’s tighter cap. That is, Washington has a lower supply of allowances relative to expected emissions allowance demand, in part because the state designed its program and allowance supply schedule with the intent of linking to other emissions markets. By the time the CCA was enacted, a large number of allowances, likely more than is auctioned in a single year in Washington’s cap-and-invest program, from the California-Québec market had been privately banked (Cullenward et al. 2019).
The right side of Figure 6 illustrates that the projected market prices in the linked Pacific market are higher than California’s unlinked price but lower than Washington’s unlinked price. Washington brings in more demand for allowances than it contributes to the linked auction supply, hence raising the market prices to the first APCR tier by 2039 and the second APCR tier by 2044. This is a small increase in allowance prices compared with California’s unlinked prices but a substantial decrease from Washington’s projected unlinked prices.
Covered entities in Washington will see lower prices in the linked market; conversely, covered entities in California will face higher prices. It is noteworthy that recent auction prices have been lower than projected because of political uncertainty about the program. After Proposition 2117, which would have ended the Washington program, was defeated in the November 2024 election, allowance prices in the secondary market rebounded to levels comparable to those presented here.
3.2. Emissions
Allowance prices affect abatement decisions, since a covered entity will purchase allowances if the cost of abatement is higher than the allowance price.
Under linkage, the lower prices for Washington mean less incentive to reduce emissions. Conversely, California entities facing higher prices have more incentive to abate. Our equilibrium model estimates these changes for each jurisdiction. Figure 7 illustrates the range of cumulative emissions changes between the two allowance demand scenarios for each jurisdiction. By 2045, emissions in Washington are projected to increase by 8 million to 14 million metric tons; emissions in California are projected to fall by about 65 million metric tons. Net reductions of greenhouse gases would exceed 50 million tons, producing a significant environmental benefit. This asymmetric outcome and net reduction in emissions are described more fully below.
Figure 7. Cumulative Emissions Changes with Linkage Compared to an Unlinked Program, 2025-2045

Greenhouse gases are global pollutants, so more emissions reductions in California benefit Washington residents as much as if they occurred in Washington. The lower carbon prices in Washington also mean that emission reductions will have less effect on carbon-intensive goods (notwithstanding the potential influence of free allocation on a firm’s product prices). However, to the extent that greenhouse gas emissions correlate with criteria air pollution, the higher emissions in Washington could lead to relatively worse air quality without additional measures. In many cases, greenhouse gas emissions are not perfectly correlated with pollutants that affect air quality. For these reasons, it is not clear whether the increase in greenhouse gas emissions implies a definitive loss of air quality benefits. This evidence informs the trade-off the state faces. Linkage is projected to result in lower compliance costs, greater regional climate benefits, and potentially slower improvements in local air quality compared to an unlinked scenario if additional measures to ensure air quality improvements are not enacted.
If total allowance supply across Washington and California were unchanged under linkage, then we would expect the higher price region of Washington to see emissions go up by exactly as much as they go down in California. However, that is not the case here. Washington purchases compliance instruments—allowances and price ceiling units (PCUs)—at the price ceiling in an unlinked scenario but not in the linked scenario, where the price is below the price ceiling and only allowances are sold. PCUs are made available to keep compliance costs from going above the price ceiling trigger price. Because PCUs are additional to the state’s emissions allowance cap, the Washington program has more compliance instruments for regulated entities in an unlinked world. We assume the proceeds from the sale of PCUs are used to procure offsets for unabated emissions. Once prices fall in Washington after linkage, these supply additions will no longer be triggered, and the total supply of compliance instruments from Washington will shrink. This is why emissions reductions under linkage are greater than the sum of emissions reductions from the two unlinked programs.
If offsets purchased at the price ceiling represent additional carbon mitigation that would not occur without Washington’s procurement, then the net climate benefits are unchanged from linkage. Since this is outside of the scope of our model, we do not highlight these as emissions reductions. The effect of a price ceiling compliance instrument is discussed later in the report.
3.3. Revenues
Under linkage, Washington is projected to have lower revenue from its auction of allowances. With the lower prices in the linked market, APCR allowances in Washington are no longer adding to supply, causing a reduction in auctioned allowances compared to an unlinked market. This decrease of allowance supply and the decrease in the carbon price lead to lower revenues. Figure 8 shows the effect of linkage on auction revenue in both states. By 2045, the total cumulative revenues in the linked market would increase by $8 billion in the high allowance demand scenario but fall by close to $20 billion in the low allowance demand scenario. The total cumulative revenues across the linked programs would be $62 billion to $134 billion.
Figure 8. Cumulative Change in Revenues with Linkage, 2025–2045

California’s increase in revenue can be attributed to the higher allowance price. As shown in Figure 7, California entities are abating more emissions, and a small portion of the allowances allocated to the joint auction by California are being purchased by Washington entities. These allowances sell at a higher price because of the higher cost of abatement (seen in the unlinked allowance price pathways in Figure 6).
Under linkage, Washington would see lower allowance prices and more emissions reductions across the linked jurisdictions while generating lower revenues and potentially fewer improvements in local air quality compared to an unlinked market.
In any scenario, program revenues are not guaranteed to be as steady as they appear in our model. For example, the potential threat of Initiative 2117 depressed auction prices (Prest 2024) such that Washington’s revenues in the 2024 auctions were lower than the projected range of quarterly auction revenues in Figure 9. This methodology involves modeling more complex than Washington’s current revenue forecasts, which use averages of previous auction prices as opposed to modeled future prices. Additionally, we forecast proceeds to the state account, not total auction proceeds. In 2024, the most recent three auction outcomes (the dots in Figure 9) in both California and Washington fell relative to 2023. Washington’s allowance prices in the secondary market have rebounded significantly since November 2024, implying higher future revenues.
3.4. Price Ceiling Effects
Missing from the above figures is a representation of the use of price ceiling units for compliance. Without linkage, Washington prices are projected to climb to the price ceiling (Figure 6), and the PCU compliance instrument then covers emissions above the cap. We assume these units are not fungible or tradable and must be used directly for compliance. The CCA requires that the revenue raised from the sale of PCUs “be expended to achieve emissions reductions on at least a metric ton for metric ton basis that are real, permanent, quantifiable, verifiable, enforceable by the state, and in addition to any greenhouse gas emission reduction otherwise required by law or regulation and any other greenhouse gas emission reduction that otherwise would occur.” That is, either the reductions must occur in sectors not covered by the emissions cap or they can happen out of state.
Our representation of emissions reductions with PCU proceeds differs from the treatment of offsets in the Washington program when prices are below the price ceiling. Regulated entities may want to acquire offsets from eligible projects to meet their obligations under the emissions cap if the offsets cost less than the market value of an allowance. In this case, however, the state brings offsets under the cap, meaning that the number of allowances available in subsequent auctions will be reduced by the number of offsets, such that the total number of compliance instruments is unchanged.
The purchase of PCUs allows for more emissions within the state. When the allowance price falls with linkage, PCUs will not be introduced as compliance instruments. However, the number of allowances purchased from the California market exceeds the total number of emissions covered by PCUs in the unlinked market, such that in total, emissions in Washington increase (Figure 7). Unlike APCR allowances, proceeds from the sale of PCUs do not contribute to state revenues, since the revenues for PCUs are dedicated to procuring reductions above the cap.
For the low and high allowance demand scenarios, Figure 10 shows both the range of emissions (blue, left axis) covered by PCUs and the range of total expenditures (green, right axis) for the procurement of offsets with PCU proceeds. Our modeling indicates that by 2045, Washington will have invested $4 billion to $22 billion to support the procurement of 20 million to 130 million PCUs. In the low allowance demand scenario, linkage leads to lower prices and up to $25 billion less revenue from the allowance auction (Figure 8). There is also an elimination of funds directed to the procurement of offsets.
Figure 10. Cumulative Price Ceiling Units Purchased and Related Expenditures, without Linkage, 2025–2045

3.5. Electricity Prices
California and Washington both provide free allocation to electric and natural gas utilities and require that all revenues from sold allowances benefit ratepayers. In California, the value of freely allocated allowances is returned to ratepayers as a climate credit—a semiannual flat rebate per customer. Washington specifically prioritizes benefits for low-income customers (CCA Section 14(4)) and requires that natural gas utilities consign an increasing majority of their allowances, to reach 100 percent by 2030; electric utilities, however, face no requirement to consign allowances for the current life of the program (through 2045). Our analysis assumes 100 percent consignment in all years for electric and natural gas utilities, with rebates to households separate from the calculation of monthly electricity bills. Hence, we do not consider revenue recycling as part of the price effects when we calculate the change in retail electricity prices.
With linkage, lower allowance prices may benefit consumers through lower electricity prices and potentially enhance the political durability of Washington’s cap-and-invest program. Higher allowance prices in California are projected to stimulate greater abatement from other sectors, which drives greater electrification in California and leads to higher electricity demand. Conversely, Washington’s lower allowance prices lead to fewer investments that require electrification. This is an opposing effect: lower carbon prices lead to lower electricity prices and reduce the cost of electrification; higher carbon prices lead to higher electricity prices and increase the cost of electrification. Our model finds an equilibrium in the power sector between these market forces.
Figure 11 illustrates the changes in electricity prices in the linked jurisdictions, with solid lines for the high emissions allowance demand scenario and dotted lines for the low emissions allowance demand scenario. Of note, average residential electricity rates in October 2024 (the most recent data available from the US Energy Information Administration) were 30.22 cents per kWh in California and 15.22 cents per kWh in Washington.
Figure 11. Percentage Change in Retail Electricity Prices with Linkage, 2025–2045

4. Market Design Considerations for Linkage
The potential effects on pollution and emissions reductions in a linked market can inform the negotiations and market rules. Of particular importance for Washington is understanding the range of possible effects on overburdened and Tribal communities, which are expected to benefit from targeted economic and environmental improvements and investments under the state’s current cap-and-invest program.
Linkage would provide greater allowance price stability over the long term, more efficient emissions reductions, and a smaller increase in pass-through prices—and thus more durable political support and enhanced climate ambition among participating entities—as well as greater total emissions reductions across California and Washington. Washington would see lower allowance prices, lower revenues, and higher emissions compared to an unlinked scenario. Under either a linked or unlinked scenario, Washington would continue to experience emission declines, the rate of decline varies between a linked and unlinked market.
Measures exist to mitigate against the potential loss of revenue and inequitable distribution of benefits and costs associated with the continued release of emissions in overburdened communities. In October 2023, Washington’s Environmental Justice Council submitted to the Department of Ecology its specific concerns for potential harms from linkage and recommended measures to ensure equitable outcomes and targeted benefits for overburdened communities and Tribes in both Washington and California.
The Environmental Justice Council listed the following concerns:
- A linked market may have an overall harmful effect on overburdened communities (or analogous communities in any jurisdiction) relative to the baseline level of greenhouse gas emissions.
- A linked market may not provide overall economic benefits or improve health outcomes for vulnerable populations and overburdened communities in Washington.
- A linked market may diminish Washington’s ability to meet its legal emissions reduction commitments or worsen air quality in overburdened communities.
- A decrease in allowance prices may disincentivize covered entities in Washington from significantly reducing their emissions, or reduce funding for critical investments in decarbonization and in overburdened communities.
- Unused allowances from covered entities in the linked jurisdictions may result in an increase of emissions in Washington.
- There has been no study or consideration of protocols, other than linkage, to mitigate the effects of higher energy prices on low-income consumers.
- Linkage may compromise the ability of Washington’s air quality program to reduce criteria pollutants in overburdened communities.
The recommended measures included the following:
- facility-specific caps (to address concerns 1, 2, and 7);
- prohibition on the use of unused allowances issued prior to Washington’s linking to California and Québec (to address concerns 3, 4, and 5);
- limitations on the use of offsets (to address concerns 3, 4, and 5); and
- establishment of expiry dates for banked allowances (to address concerns 3 and 4).
The remainder of this report considers mechanisms to implement these Environmental Justice Council’s recommendations. To this analysis we add consideration of an emissions containment reserve (ECR), discussed first, which already exists by statute as a component of Washington’s cap-and-invest program. An ECR can provide the critical function of protecting allowance revenue for Washington while giving covered entities the efficiency benefits of access to a greater pool of emissions reduction opportunities.
4.1. Emissions Containment Reserve
An ECR is a readily available tool that buffers allowance prices from reaching the price floor. It provides a minimum price (higher than the price floor) for specified quantities of allowances, enabling improved responsiveness between ex ante conditions affecting greenhouse gas emissions and the carbon market (Burtraw et al. 2017; Goldberg and Grossman 2024).
In its standard implementation, the ECR automatically adjusts the supply of emissions allowances when the price of allowances falls below the specified price. It places a tranche of allowances from the annual nominal allowance budget in a reserve; these allowances would enter the market only if the auction settlement price were equal to or above the ECR trigger price. This mechanism would be integrated into the auction in a similar way to the existing auction price floor. It would accelerate emissions reductions by reducing the supply of allowances when the market price signals that those reductions are inexpensive. An ECR has been used in the Regional Greenhouse Gas Initiative since 2021.
This rule-based approach to adjusting allowance supply in response to market signals reduces uncertainty for compliance entities and lowers administrative costs for regulators. In contrast, ad hoc adjustments to supply that are implemented by the regulator can create uncertainty and the expectation that one administrative intervention foreshadows further program interventions, which can destabilize allowance prices and reduce market participation.
Roy and Burtraw (2024) analyzed three emissions budget pathways under consideration by CARB for upcoming rulemaking related to the 2022 scoping plan update and other climate legislation. The report analyzed how each budget affected revenues and how an ECR could enhance revenues. The analysis revealed that an ECR would support allowance prices when they are low and increase and stabilize revenues for the state’s Greenhouse Gas Reduction Fund. Notably, the ECR was found to be uniquely suited to improving revenue stability without affecting overall program affordability for residents because it is triggered only when prices are low; it does not drive all prices up.
This report contemplates possible reductions in revenues for Washington—and by extension its communities—from allowance auctions as a possible result of linkage. Linkage could lead to lower revenues due to the price that emerges in the linked market when compared with the price in separate markets, as discussed above. Lower revenues may affect the state’s timeline for achieving the CCA emissions targets by reducing investments and delay benefits for overburdened communities.
The ECR can mitigate another concern as well as preserve revenues: it could prevent backsliding when other factors, such as advances in technology, reduce the cost of compliance. The availability of California’s and Québec’s banked allowances in a linked market could be another cause for backsliding if linking enables an increase in emissions in Washington.
Legislatively, an ECR is already a part of Washington’s cap-and-invest program; it only needs action by the Department of Ecology to set a trigger price and reserve quantity. Linkage gives Washington an opportunity to establish a trigger price for its ECR, activating this mechanism for Washington and potentially influencing a similar policy outcome in California and Québec. Such a market-based mechanism could balance the opportunities for lower-cost emissions reductions in an expanded, linked market with mechanisms to capture more value from auctioned allowances. The ECR would thereby provide additional revenue assurance for funding the programs and activities described in the CCA.
However, an ECR may not work to the state’s advantage if Washington were the only jurisdiction in a linked market to implement it because it could reduce revenues (through fewer auctioned allowances) while supporting the price to the benefit of the other jurisdictions. Hence, in a linked system, it makes sense to activate the ECR only if it is adopted by all the participating jurisdictions. The ECR has already been recommended by California’s Independent Emissions Market Advisory Committee and California’s Environmental Justice Advisory Committee. This mechanism would enhance robustness of the Washington market whether it stands alone or is adopted by California and Québec as part of a linked market.
Figure 12 illustrates an ECR as an additional step in the existing allowance supply curves of Washington and California. At high equilibrium prices, price containment reserves and the price ceiling add supply to the right of the nominal cap (illustrated as a dashed blue line); at low equilibrium prices, the ECR and the price floor reduce supply. In our model, the ECR removes up to 5 percent of the cap when prices are below the trigger price (about $40 in this case). The red step shows the new supply curve with an ECR; the solid black line shows the supply curve without an ECR. The grey lines show the part of the supply curve that has been removed with the introduction of an ECR. Thus, if shifts in the demand curve (whether due to macroeconomic conditions, technological development, sector-specific regulations, or corporate actions) alter the demand for allowances, yielding a different equilibrium auction price, an ECR adjusts the allowance supply accordingly and thus accommodates some of that change (Goldberg and Grossman 2024).
Figure 12. Cumulative Allowance Supply with ECR, with and without Linkage

Figure 13 illustrates how an ECR would affect prices in a linked market. The left panel presents the same price projection as in Figure 6, with an additional dashed red line to indicate the ECR trigger price. The right panel shows how our model responded to the introduction of this supply adjustment mechanism, leading to higher prices in the low emissions allowance demand scenario. Note that the high allowance demand scenario is unaffected by the ECR.
Figure 13. Allowance Price Effects of ECR with Linkage, 2015–2045

The higher prices in the low allowance demand scenario occur by reducing the availability of allowances in the auction. The result is a lower quantity sold in auction and a higher price than would be observed without the ECR. Because allowance demand is relatively inelastic, increases in prices relative to the number of allowances removed from the market are sufficient to raise the revenues above levels that would occur without the ECR. Figure 14 compares the potential revenue generated with and without an ECR. The green bars indicate the annual auction revenues from allowances offered by the Department of Ecology and the grey bars above them show the additional increase in revenues from the reintroduction of Washington’s ECR to the broader linked market. In the low allowance demand scenario with an ECR, fewer allowances are available in the auction and thus the allowance price is higher. Because allowance demand is relatively inelastic, the higher prices are sufficient to raise revenues, despite the smaller supply of allowances.
Figure 14. Annual Revenue with Linkage, Low Allowance Demand Scenario, 2026–2045

Between 2026 and 2036, the ECR’s effect on revenues is small because of the reduced supply of allowances in the auction, but revenues are still projected to increase by 10 to 15 percent. After 2036, the ECR is no longer binding, meaning that the anticipated availability of allowances in the auction is not affected, but prices remain higher because of earlier reductions in supply. Hence, revenues are consistently 31 percent higher after 2036. In total, with linkage, the ECR would raise Washington’s revenues by $3.47 billion compared with the same scenario without an ECR. This can offset some of the revenue losses incurred from a lower allowance price.
Future effects aside, the mechanism could be generating revenue today if it had been triggered in recent low-price auctions. In 2024, three allowance auctions settled below our proposed ECR trigger price (the midpoint between the price floor and the first APCR tier). Figure 15 shows recent auction settlement prices (left) and the extra revenues if an ECR had been implemented (right). If an ECR had been in place, the auctions would have raised an additional $50 million.
Figure 15. WA Historical Revenue Trends with ECR, 2023–2024

Source: Washington Auction Reports
To approximate the reduction in allowances sold from the ECR, we use an elasticity calculated from our model of 0.15 percent decrease in allowances demanded for a 1 percent increase in price. The ECR would not increase auction prices if the price is above the ECR trigger price, as was the case in 2023.
Our counterfactual shows how an ECR can preserve revenues when allowance auction prices fall idiosyncratically. Postulated drivers for recent price declines include the political uncertainty from Proposition 2117 and the anticipated linkage with California. In the future, regulatory decisions in linked jurisdictions, new abating technologies, or other external shocks could lead to falling prices. The ECR is designed to preserve revenues and emissions reductions if this occurs.
4.2. Facility-Specific Emissions Caps
Although most of Washington’s air pollution comes from the transportation sector, many counties are affected by SO2 and NOx from stationary sources in the power and industrial sectors (Figures 2 and 3). These facilities are subject to the emissions cap, but firms could still increase emissions in overburdened communities (or communities designated by Department of Ecology’s community indicators) while achieving reductions elsewhere. Figure 16 shows the distribution of emissions-generating stationary facilities and their proximity to vulnerable or overburdened communities. Red dots indicate facilities in overburdened communities (as defined by the Department of Ecology, about 20 percent of total facilities). Orange dots indicate facilities in communities that meet the environmental health disparities index, EJScreen demographic index, and Tribal lands classification but not the final designation of overburdened communities (about 40 percent of total facilities). Gray dots indicate facilities located outside those communities (about 40 percent of total facilities).
Figure 16. Overburdened Communities and Stationary Sources of Emissions

Linkage would likely result in a slower rate of emissions reductions in Washington’s overburdened communities (Figure 1). To accelerate improvements in environmental and economic conditions in these communities, the cap-and-invest program could include facility-specific emissions caps (FSECs).
In California and Washington, the Environmental Justice Advisory Councils have recommended the use of FSECs as a top priority. The various approaches to implement this recommendation would have differing effects on facility operators. We assume an emissions cap would require that emissions at identified facilities—whether in overburdened communities (20 percent of facilities) or, more broadly, in communities that meet the indicator thresholds (60 percent of facilities)—are realized at a pace that meets or exceeds the average statewide rate of reduction. Facilities that exceed the rate could sell allowances to other facilities, preserving the incentive to achieve additional emissions reductions.
Burtraw and Roy (2023) found that in California, a facility-specific cap requiring all covered facilities in disadvantaged communities to reduce emissions at least as quickly as the economy-wide emissions cap, without increasing emissions at other facilities, would have reduced emissions of carbon dioxide in disadvantaged communities by 29.3 million metric tons, cumulatively, between 2013 and 2020. If the ratio between pollutants and greenhouse gases were constant at each facility in each year, these facility caps could have reduced correlated nitrogen oxide emissions by an estimated 5,900 tons between 2013 and 2020 (677 tons lower in 2019) and sulfur oxide emissions by 1,700 tons (78 tons lower in 2019) in those communities. Estimates of local criteria pollutant reductions were calculated with sectoral pollution correlation coefficients.
Assessing an FSEC implemented alongside a 48 percent emissions reduction target as part of California’s cap-and-trade rulemaking adjustment efforts, Roy et al. (2024) found that facility-specific caps would contribute a small cumulative reduction in local emissions of 8.3 to 11.2 MMT by 2030, with consequent health benefits in these communities.
Roy and Burtraw (2024) analyzed the California Environmental Justice Advisory Council’s recommendation to require a reduction in the overall allowance budget commensurate with reductions achieved at sources covered by FSECs to ensure that emissions did not increase at facilities in other neighborhoods. They found that this approach would require reducing the overall allowance budget by only 2 million tons, or 0.72 percent of the total allowances issued in 2024, with little effect on the allowance price. More stringent FSECs could further preserve revenues that Washington might otherwise lose with linkage.
Implemented in tandem with linkage, FSECs can be a market-based backstop to air quality regulations, ensuring emissions reductions in disadvantaged or overburdened communities across jurisdictions at a rate equal or greater than the state’s average. If state air quality regulations are equally or more stringent than FSECs and if compliance reporting for both regulations can be combined, then there may be no additional cost to facilities to comply with this requirement.
FSEC policies can allow for flexibility in implementation and consequences. Emissions reduction standards could be tied to specific levels over a designated timeline. Alternatively, the FSEC could be designed as a “meet or exceed” policy, in which facilities in overburdened communities must at least meet average rates of emission reductions achieved for the state as a whole. State authorities have flexibility to determine penalties for noncompliance, ranging from inclusion on a public noncompliance list (“naming and shaming”) to heavy fines to changes in eligibility for use of offsets or requiring that the facility surrender two allowances for every ton above its cap. Imposition of penalties is already within the authority of the Department of Ecology.
FSEC policies directly tied to cap-and-trade programs should be studied further by state agencies using facility-specific information on the costs of compliance and abatement. Questions remain about which sectors directly correlate criteria pollutant reductions with GHG reductions, how to treat EITE industries, The CCA requires that by 2027, Washington’s legislature must determine EITEs’ allowance allocations past 2034; the levels will be important for achieving emissions reductions from high-polluting facilities. and what facilities are contributing most to air pollution in disadvantaged communities. Washington and California could consider commissioning independent studies to further investigate the potential of FSECs.
4.3. Use of Banked Allowances
Another mechanism that can improve overall market efficiency for Washington, either in a standalone program or linked with California’s market, involves setting expiry dates for the use of banked allowances (or prohibiting their use), as recommended by the Washington Environmental Justice Council. Although the political feasibility of making bilateral adjustments to the bank as part of linkage is low, we consider how Washington could mitigate the effect of California’s banked allowances on emissions and auction revenue under a linked program.
In both Washington and California, allowances can be banked by covered emitters and other market participants for use in future compliance cycles. Allowance banking helps covered entities plan emissions mitigation investments and control allowance costs. By statute, California’s banked allowances do not have an expiration date, although there are limits on how many allowances each market participant can bank at a given time. In a linked program, California’s large allowance bank could enable emissions increases.
RGGI also allows covered entities and other market participants to bank allowances. However, RGGI’s statutes allow for adjustments to the allowance base budgets of participating states to account for the number of banked allowances carried over from one compliance period to another. In program reviews, RGGI has executed a “bank adjustment” that reduced allowances available for auction to draw down the private bank and support the allowance price. RGGI’s participating states have adjusted their allowance base budgets three times by an amount equivalent to the size of the private bank. The most recent action, the Third Adjustment for Banked Allowances, occurs over a five year period, from 2021 to 2025, and reduces the allowance base by 95,451,650 units.
Three options for modifying the use of banked allowances in a linked market may help ensure that California’s bank does not depress emissions reductions in Washington under a linked scenario: (1) discounting compliance values of banked allowances, based on their vintage; (2) restricting the use of allowances banked prior to linkage; and (3) establishing an expiration date for banked allowances.
Discounting banked allowances based on vintage for use in future compliance cycles would preserve many of the benefits of banking for participating entities while accounting for inflation and raising emissions reduction ambition. A vintage-differentiated compliance value would enable Washington to assign a lower value to allowances banked prior to linkage if they are used for compliance in Washington’s market and/or to adjust the value of allowances on a rolling basis over time or tied to inflation. Of its own accord, Washington could restrict the use of allowance vintages that precede linking as compliance mechanisms for the state; however, this restriction would be ineffectual unless it was implemented jointly in California. If implemented only in Washington, early vintage allowances could be acquired and used in California while recent vintage allowances are used in Washington. A discount on banked allowances would serve as a continuous market adjustment instrument. In contrast, restricting the use of allowances banked prior to linkage or applying an expiry date would provide a one-time market adjustment.
To be effective, each of those approaches would require amending the authorizing statutes in California and Washington, and the necessary legislation is unlikely. If Washington chooses to consider these measures, further policy research would be needed to develop these ideas into robust market design.
4.4. Alignment of Offsets
Offsets can provide an important instrument for cost containment. Rules governing the use of offsets in Washington’s cap-and-invest program provide an opportunity to increase environmental protections in California and Québec if they are adopted across all jurisdictions as a part of linkage. In Washington, offsets used for compliance are counted under the overall emissions cap. In other words, every offset used leads to a decrease in allowances offered for auction. California does not count offsets used as compliance instruments under the overall cap, which may result in an expansion of allowable emissions. Future modeling could seek to provide insights into the effects of California bringing its offsets under the cap.
In Washington, all offsets qualifying for compliance must provide environmental benefits to the state. The CCA includes a provision (WAC 173-446-600) that addresses linkage: “If [the Department of] Ecology has linked with an external GHG trading system, at least 50 percent of any offset credits used by a covered entity or opt-in entity for compliance must be sourced from offset projects that provide direct environmental benefits in Washington state. The remaining amount must be located in a jurisdiction with which Ecology has linked.” The share of offsets that provide Direct Environmental Benefits increases to 75 percent in Washington’s second compliance period. In California, half of offsets must deliver direct environmental benefits. Adopting Washington’s rules across all linked jurisdictions could reduce cumulative emissions, providing a net benefit to the region.
Washington’s Department of Ecology has the right to reduce the amount of offsets that can be used by an entity that contributes substantively to air pollution in overburdened communities. More information on how and how much Ecology can reduce offset use can be found in Washington’s RCW 70A.65.170(3)(a), -(b),-(d), and -(e). California’s program does not include a similar protection.
5. Conclusion
Compared with no linkage, linking Washington’s carbon market with the California-Québec market would produce greater overall emissions reductions across the linked jurisdictions and improve the program’s affordability. However, our analysis found that linkage would likely result in lower revenue and a slower rate of emissions decline in Washington compared to an unlinked scenario. The program stability delivered by linkage and the associated effects on program revenue and investment are not directly captured in economic modeling and thus not quantified, but they are nevertheless significant.
When establishing its cap-and-invest program, Washington had the benefit of learning from California’s decade-old carbon market. Cost containment mechanisms, offset design, and other aspects of the Washington program mirror that of California. Because of these similarities, the two states are well prepared for linkage. On that shared foundation of market design, the Evergreen State implemented more robust measures for offset usage, consultation with overburdened communities, and overall program stringency. Linkage could therefore facilitate policy learning in the other direction, with California learning from Washington.
Washington’s more progressive environmental and community commitments could enhance California’s program if appropriate market design mechanisms, such as an emissions containment reserve, are implemented across the linked jurisdictions. Washington has a unique opportunity to advance environmental and climate justice by encouraging California to update its program features as a part of the linkage negotiations. Washington could also inspire other states, particularly New York and Maryland, that are considering economy-wide cap-and-invest programs with linkage.
Central to Washington’s negotiations for linking with California are trade-offs. In our modeling, a Washington-only market is projected to experience a rapidly increasing price that reaches the price ceiling before the end of the decade. Linkage will lead to lower prices, lower revenues, increased program affordability, and a slower rate of emissions reduction for Washington. Though the effects on revenues and emissions may be cause for concern for Washington’s overburdened communities, linked markets are more stable and less volatile and thus less likely to lead to revenue volatility or program repeal. Another consideration is that the lower allowance prices in a linked scenario mean greater affordability for households that may experience pass through costs from corporate compliance with cap-and-invest emission reduction targets.
To ensure that a linked program delivers air quality improvements in overburdened communities, Washington can consider the policy mechanisms proposed by the Environmental Justice Council. Facility-specific emissions caps, changes to the use of banked allowances, and alignment of offset policies would involve trade-offs with local benefits and are politically not likely to be adopted. An emissions containment reserve, on the other hand, can increase state revenue without sacrificing cost efficiency for covered entities, but only if it is adopted across all linked jurisdictions. Discussion and consideration of the trade-offs will be core to Washington’s linkage negotiations.