Charging Up: The State of Utility-Scale Electricity Storage in the United States
This report explores how economic forces, public policy, and market design have shaped the development of stand-alone grid-scale storage in the United States.
Abstract
Grid-scale storage can play an important role in providing reliable electricity supply, particularly on a system with increasing variable resources like wind and solar. Economics, public policies, and market rules all play a role in shaping the landscape for storage development. In this report, we offer an overview of these factors, drawing on the relevant literature and ongoing policy dialogue. We explore the potential role these factors have played in shaping the growth of storage across the United States.
1. Introduction
As the electricity sector relies more on variable energy sources like wind and solar, grid-connected energy storage will become increasingly important to support reliable electricity supply. Storage can transfer electricity generated during hours when renewable energy is plentiful to meet demand at other times of the day. Grid-scale storage specifically can also provide key grid services, such as reserve power, frequency response, and flexible ramping, to support grid stability.
As the needs of the grid evolve, storage can provide effective solutions, but it does not always fit neatly into the market designs and operating practices in the electricity sector. It remains unclear what types of market designs and incentives are needed to elicit optimal storage deployment without overprocuring storage relative to more efficient options. This report reviews drivers of grid-scale storage deployment in the United States, identifying progress and barriers to a robust storage landscape, with a focus on the economics of and markets for stand-alone storage technologies. We provide a review in Section 2 of what the literature has to say about the potential economic value of storage now and under different future scenarios. In Section 3, we describe policies in place and under discussion that could have an impact on grid-scale storage deployment. Section 4 highlights market structures and rules that affect storage operations and incentives, and Section 5 discusses how these factors contribute to the current trends in grid-scale storage deployment across the United States. Section 6 concludes.
2. The Role for Energy Storage in the Power Sector Today and Tomorrow
Grid-scale energy storage has been growing in the power sector for over a decade, spurred by variable wholesale energy prices, technology developments, and state and federal policies. In this section, we identify several different potential roles for energy storage in the modern grid. Then we discuss how a high-renewables future may expand the value of energy storage solutions.
2.1. Current Uses of Energy Storage
2.1.1. Arbitrage
One of the main roles for storage in the power system is energy price arbitrage. Simply put, batteries can act as demand when energy prices are low and as supply when prices are high, taking advantage of price fluctuations. As an increasing number of low-marginal-cost renewables participate in the market, arbitrage can effectively extend the availability of that low-cost energy across more hours in the day.
Different modeling efforts have attempted to capture the potential impact of adding energy storage to wholesale energy markets to engage in arbitrage. Qin et al. (2023) study the impact of short-duration battery storage capacity and market participation strategy on carbon emissions, generation cost, and consumer costs. They find that storage impact on electricity markets depends on several factors: renewable energy deployment, storage capacity, and participation in real-time versus day-ahead markets.
Qin et al. consider different market opportunities for storage arbitrage in a model of the New England grid. The modeling estimates that storage participation will lower electricity prices and emissions, particularly with a high penetration of renewables. Electricity prices drop the most when storage participates in the real-time market, while emissions decrease the most when storage participates in the day-ahead market. However, Qin et al. also find that as total storage capacity increases from 1 to 5 gigawatts (GW), the marginal price and emissions impacts diminish. Figure 1 shows the diminishing profits across different market participation strategies (real-time, day-ahead, and dual participation) as storage capacity increases. Storage profits diminish significantly as storage capacity increases because each additional unit of storage capacity reduces the arbitrage opportunity for other storage owner/operators. Any given amount of storage capacity is more profitable with a higher level of renewables in the system (see panel C). In their analysis, Qin et al. find the greatest profit opportunities in the real-time market, in part because they assume storage operators bid physical costs and parameters in the day-ahead market, and bid to maximize arbitrage profits in real-time (using day-ahead price forecasts). Under dual participation, storage operators may lose out on real-time price volatility because of how they were scheduled day ahead, particularly if they can’t foresee real-time arbitrage opportunities.
Figure 1. Storage Profit Under Different Levels of Wind Penetration
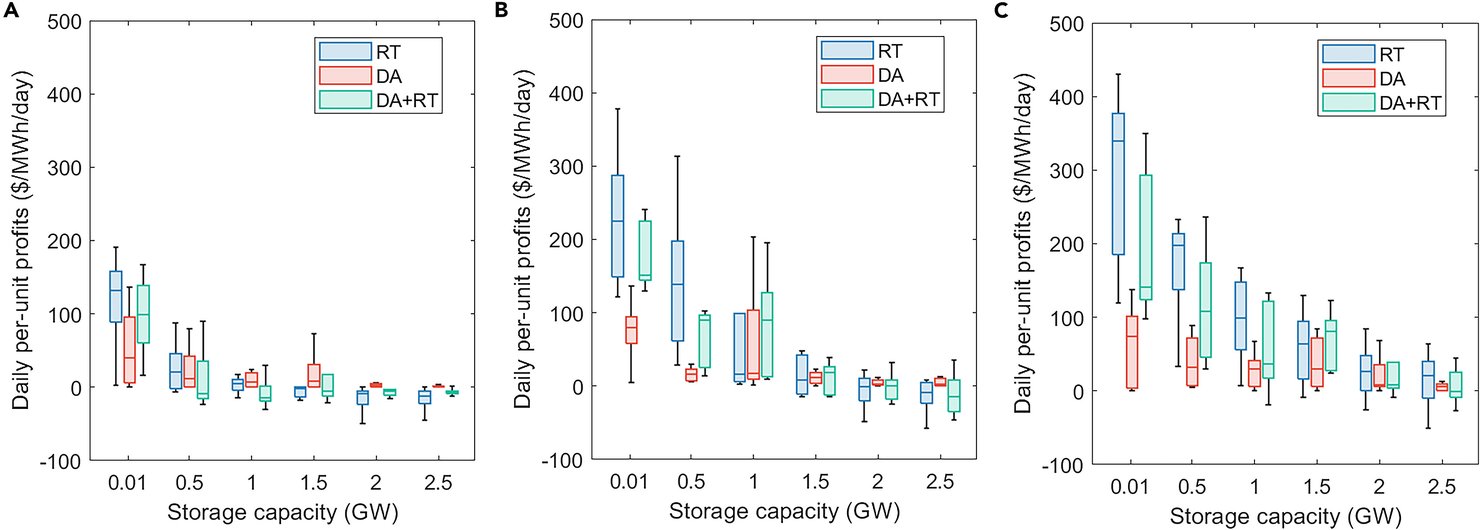
Source: Qin et al. (2023).
Note: Storage profit under (A) low (6.5 GW), (B) medium (13 GW), and (C) high (26 GW) wind penetration. RT = participation in the real-time market only; DA = participation in the day-ahead market only; DA + RT = dual participation. The per-unit profits are per MWh of storage capacity per day.
Overall, the opportunity for storage to operate as arbitrage depends on price volatility, which may increase with the penetration of renewables or high-cost peaking resources. There is a limit on the amount of storage capacity that can be profitable, particularly if other arbitrage providers are considered. For example, greater demand response and increased transmission between regions could help stabilize prices and limit profits for additional energy storage capacity. Many power sector experts agree that transmission is currently underbuilt (DOE GDO 2023) and that managed load programs, demand-response programs, or variable-pricing policies that take advantage of the flexibility of the demand side of the electricity market are underused. If policy efforts to expand transmission and active demand-side participation in electricity markets are successful, profitable storage opportunities may be fewer. For example, in the National Transmission Planning Study (DOE GDO 2024), storage penetration varied noticeably across different transmission expansion scenarios. The scenarios with the greatest transmission expansion had less storage (as a percentage of total capacity) than the scenarios with moderate transmission expansion, reflecting the fact that storage and transmission may be substitutes in some cases (Biancardi et al. 2024; Bustos et al. 2018; Neetzow et al. 2018).
2.1.2. Ancillary Services
Ancillary services are a class of products intended to maintain stable operation of the grid rather than serve electricity demand directly. For example, generators may be paid to help maintain a consistent frequency on the grid through small adjustments in operation and to make sure the system has sufficient resources to absorb sudden losses of large components, such as major transmission lines or large generators. Historically, these services have been provided by fossil fuel generators because of their ability to adjust output relatively quickly on demand, but batteries have become an increasingly competitive player in these markets because of their instantaneous ramping capability. Some ancillary services, such as the frequency regulation just described, are deployed on a much shorter time frame, second to second, and typically for small-megawatt (MW) quantities. As a result, storage devices do not need long durations to take advantage of certain ancillary service markets. As discussed in Section 5, ancillary services make up a major part of the current storage revenue stack.
Market experts have estimated that in some markets, such as the Electric Reliability Council of Texas (ERCOT) and the California Independent System Operator (CAISO), storage is nearly saturating the ancillary service markets, meaning sufficient capacity is available that prices, and corresponding revenues are declining (Vermillion 2023b; Ascend Analytics 2023). For instance, when battery storage entered the California market, its main revenue source was up- and down-regulation services. Since that market was small, only several hundred MW of each of those products, the market quickly became saturated as batteries exceeded 10 GW in 2024 (CAISO 2024).The pace and degree of saturation in the relevant ancillary service markets depend on growth of storage capacity and opportunities for arbitrage in the energy markets, which may decrease the amount of storage capacity set aside for ancillary services.
Operators of storage devices do not necessarily exclusively charge at the lowest energy prices when they sell in ancillary service markets, and there may be some unanticipated consequences. For example, batteries may need to be charged during a relatively high-price period in the energy market to maintain state of charge requirements (ee Section 4.4) (Mansfield and Konet 2023). Research indicates that until there is sufficient renewable energy in the generation mix, battery operation in ancillary service markets may also lead to an increase in emissions due to spillover effects in the energy markets as fossil generators alter their operations to meet battery-charging needs for energy (Buchsbaum et al. 2024; Ryan et al. 2018; Mansfield and Konet 2023).
2.1.3. Capacity and Resource Adequacy
Energy storage can also support resource adequacy by counting toward a system’s total installed capacity. Through capacity markets or other resource adequacy constructs, storage providers are compensated for their potential to provide energy in the future, particularly when the expectation is that demand will be high or supply low. The treatment of storage in capacity markets varies by region (see Section 4.2), but generally, longer-duration storage providers can receive more compensation than their short-duration counterparts because the storage they provide is more likely to be available when needed. As variable generation increases and energy prices fall, generators may increasingly turn to capacity payments to cover their going-forward costs (Lo Prete et al. 2024). Generator retirements can also increase capacity payment opportunities for new generators. The summer 2024 capacity auction in the PJM regional transmission organization (RTO) saw record high prices after a series of generator retirements left it with diminished supply of capacity (PJM 2024).
Capacity payments can also encourage the expansion of hybrid resources where storage is co-located with generation like wind or solar plants. Variable resources have relatively low-capacity value on their own, because they are intermittent and can’t always provide energy on demand. By adding on-site storage, variable generators can extend their availability and secure greater capacity payments (Stenclik et al. 2022).
Having storage on the system also introduces a new type of electricity demand that could affect system-wide capacity needs. Unlike generators, storage also acts as demand for electricity, and that side of the storage operation needs to be considered in the load forecasts to ensure resource adequacy. While storage engaging in arbitrage is unlikely to consume electricity when prices are high, batteries obligated to provide ancillary services could still strain the system at times of high energy demand.
2.1.4. Storage as Transmission-Only Assets
Storage can also contribute to transmission congestion relief by shifting peak demand to off-peak time periods at constrained locations on the grid. In many markets, energy storage can act in this way as a transmission asset, remunerated with a regulated rate instead of through sales of a market product. After a 2016 technical conference, the Federal Energy Regulatory Commission (FERC) released a policy statement providing guidelines for the cost-based regulated pricing of storage as transmission-only assets (SATOAs). Following the release of FERC’s policy statement, several independent system operators (ISOs) and RTOs submitted their SATOA integration proposals to FERC. SATOA is currently implemented by the Midcontinent Independent System Operator (MISO), the Independent System Operator of New England (ISO-NE), and the Southwest Power Pool (SPP). The New York Independent System Operator (NYISO) and the Pennsylvania-New Jersey-Maryland Interconnection (PJM) proposals are still under development, and CAISO and ERCOT do not currently support storage as a transmission-only asset despite ongoing discussions highlighting the value of such a service.
In a presentation on considering storage as transmission in NYISO (Zoellmer 2023), several challenges and considerations were identified:
- integrating energy storage in transmission-planning processes, including local transmission planning, reliability studies, economic studies, and public policy studies
- evaluating SATOA against other transmission solutions, including line buildout and deployment of grid-enhancing technologies, in terms of efficiency, cost-effectiveness, and identification of unique attributes of SATOA
- incorporating SATOA in the interconnection process
- establishing capacity and duration requirements, including asset modeling of installed reserve margin and locational minimum installed capacity requirements
- defining ownership requirements and operation and maintenance responsibilities
- considering potential use in contingency management
FERC has publicly stated that storage could be used as a dual-use asset, acting as both a transmission and a generation resource, in accordance with established rules (FERC 2017). However, no deregulated market currently permits dual use, although California has considered possible mechanisms for doing so. The main concerns are cross-subsidization and adverse impacts in the competitive markets and management of the state of charge across the different product categories.
2.1.5. Storage in Vertically Integrated Utilities
Vertically integrated utilities own generation, transmission, and distribution systems in their geographic service territories. These utilities receive a fixed rate of return on capital investments, as regulated by the relevant public utility commission, and regulators approve investments and costs that include this rate of return on those investments in setting electricity rates designed to recover those costs. This rate-making structure offers some potential benefits to batteries and other forms of grid-scale storage. Because a single utility owns the grid and generation infrastructure, storage assets owned by vertically integrated utilities can be used to support energy, transmission, and grid services all at the same time. One challenge for energy storage proliferation in vertically integrated utilities is the lack of an hourly price signal in a competitive wholesale energy market. Energy arbitrage opportunities become clear when there are large swings in day-ahead and real-time prices that storage devices can capitalize on. Without those large swings, vertically integrated utilities that operate outside of organized wholesale markets may be slower to see the value or opportunity in building new storage devices.
There is limited evidence of growing storage investment by vertically integrated utilities compared with independent power providers. The EIA reports generation by ownership class, but with limited detail. The investor-owned utility (IOU) category includes vertically integrated utilities but may also include utilities that only own transmission and distribution assets. In 2023, investor-owned utilities owned approximately 36 percent of electricity capacity but only 13 percent of storage capacity. The share of IOU owned storage capacity is slightly less than investor-owned utility ownership of wind (19 percent) and solar (18 percent) resources (EIA 2023b). This comparison does not perfectly represent the prevalence of storage in vertically integrated utilities, but we do not observe any preferential investment in storage compared with other zero-emissions generation in these data.
2.2. Role of Storage in a High-Renewables Future
Much of the assumed value of energy storage across the products and services discussed in Section 2.1 comes from variable prices, particularly over time. As grid decarbonization efforts continue and low-cost renewables proliferate, price variability is expected to grow (Armstrong et al. 2022). Therefore, we expect the value of storage to increase with the expansion of variable resources like wind and solar. Figure 2, from Mallapragada et al. (2023), shows the impact of imposing 5 grams per kilowatt hour (g/kWh; 98.9 percent carbon reduction from baseline) and 1 g/kWh (99.8 percent carbon reduction from baseline) emissions standards on the generation capacity mix in 2050. As the results show, more stringent carbon constraints cause a large portion of natural gas capacity to be replaced with increased variable generation (yellow and green), energy storage (brown), and a small share of gas with carbon capture (orange).
Figure 2. Annual Generation Under Various Levels of Carbon Constraints
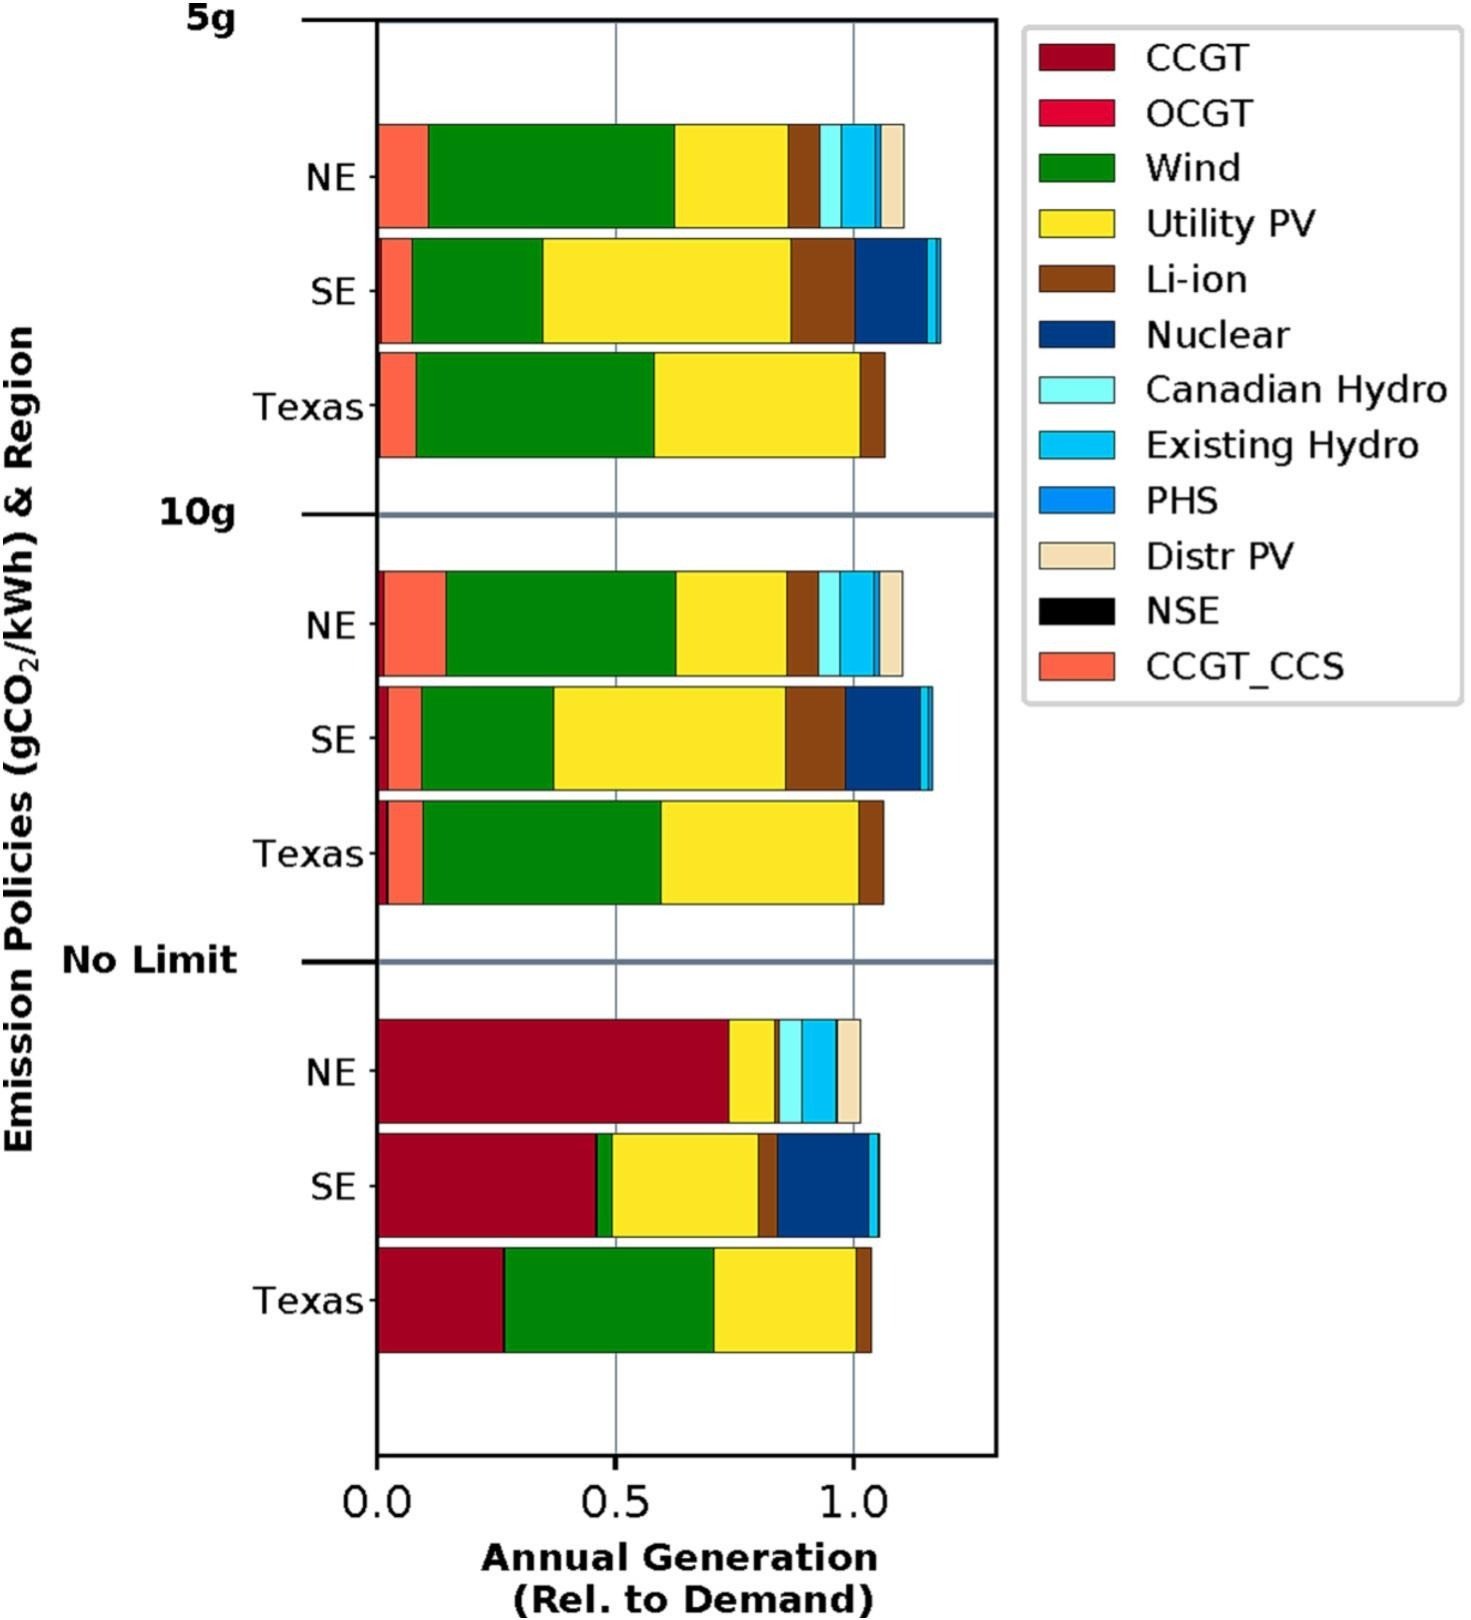
Source: Mallapragada et al. (2023).
Note: CCGT= combined cycle gas turbine; OCGT=open-cycle gas turbine; PHS=pumped hydro storage; Distr PV= distributed photovoltaic; NSE= non-served energy; CCGT_CCS= combined cycle gas turbine with carbon capture and sequestration.
Figure 3 shows potential distributions of energy prices in ERCOT (which are equivalent to the marginal value of energy) historically and across different emissions and flexible technology scenarios. The emissions limit cases range from 50g CO₂/kWh to 1g CO₂/kWh in 2050. Technologies within each emissions scenario include different combinations of existing storage technologies (including lithium ion and pumped hydro storage in the base case), redux flow batteries, thermal storage, and hydrogen electrolysis at different prices. As the results show, the shares of hours with very low ($0–$5/MWh) and very high (>$200/MWh) prices in the system increase as carbon constraints tighten, with some variation depending on available technologies. This finding is the direct result of renewable generation dominance under stringent carbon constraints.
Figure 3. Price Variability in ERCOT Under Different Emissions Policies and Storage Environments
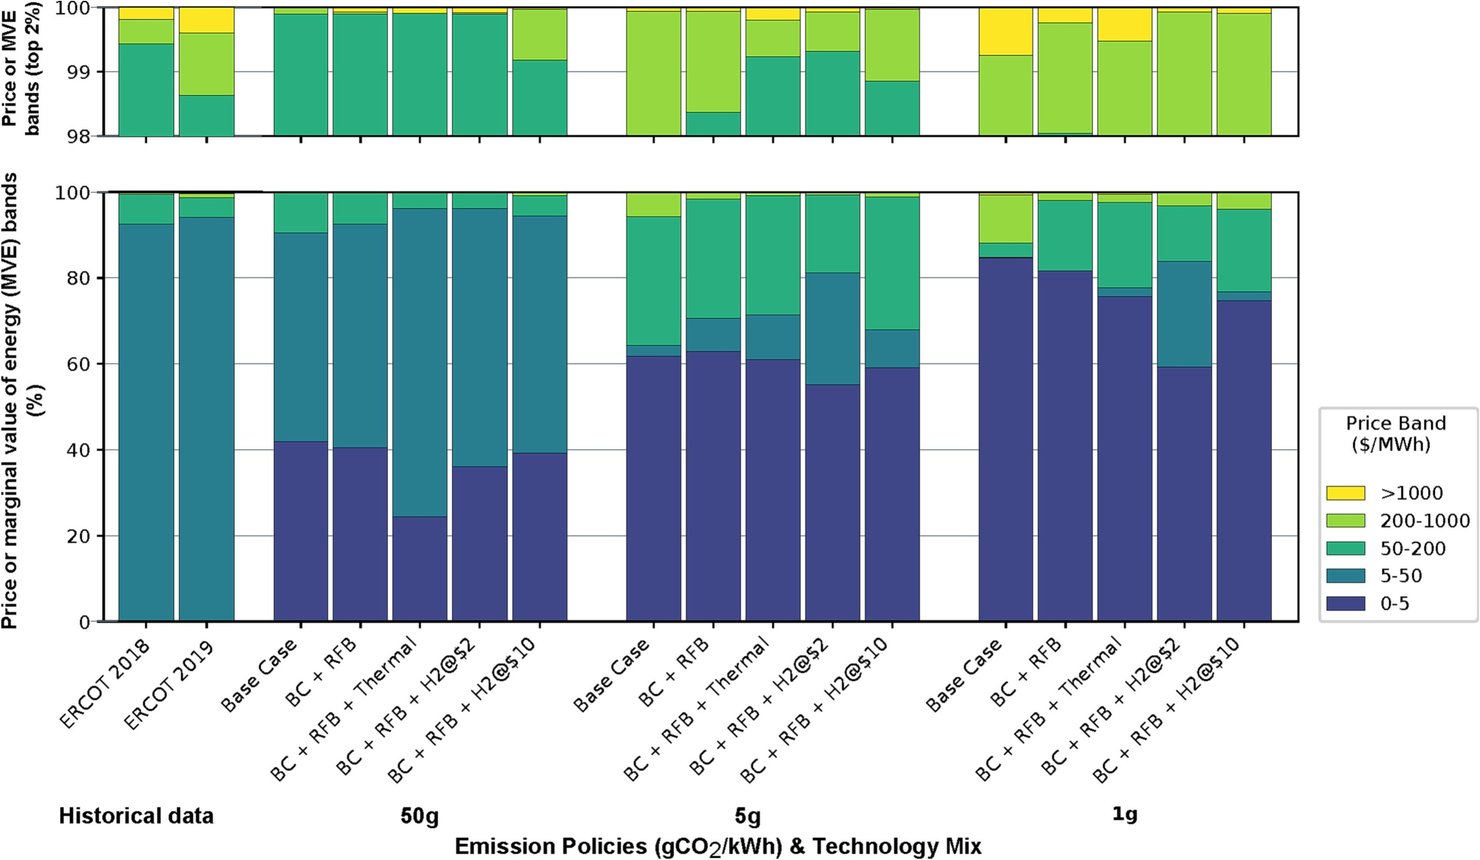
Source: Mallapragada et al. (2023).
Note: BC=base case; RFB=redux flow batteries
Very low prices generally indicate renewable generation curtailment during excess-generation periods, and very high prices reflect reliance on scarcity prices to attract suppliers. The moderate prices in between (teal-colored bands) usually represent marginal costs, and the share of hours where those prices prevail grows thinner under tight carbon constraints. Integration of longer-duration energy storage can extend the duration of moderate prices, with those prices being determined by hydrogen or another advanced technology. Demand-flexibility programs, which compensate consumers for reducing their electricity usage, could reduce the number of very high price hours (light green and yellow bands).
As price fluctuations become more dramatic, price caps may become increasingly attractive to policymakers. However, price caps may endanger the cost recovery of both generators and storage owners and can contribute to a “missing money” problem—that is, the lack of sufficiently high energy prices and thus energy market revenues to cover costs and incentivize investment during periods of tight supply. As discussed in Section 4, price caps may also lead to distorted incentives for storage operations if they discourage storage from saving their energy to meet system peaks (CAISO 2024). To address this problem, current capacity markets developed to support investment in thermal generators may need to be adjusted to work well to support investment in renewable generators and energy storage. Lo Prete et al. (2024) discuss a wide variety of proposed market designs that may ensure resource adequacy and address the missing money problem. These proposals vary in the extent to which they support and integrate energy storage and preserve peak shortage prices.
2.3. Potential for Long-Duration Energy Storage
The US Department of Energy (DOE) estimates that the US grid might require 225–460 GW of long-duration energy storage to support a net-zero grid by 2050. By comparison, approximately 22.9 GW of pumped hydro storage capacity has been built to date, and there is no significant battery capacity with intraday (10–36 hours) or multiday (up to or even beyond 160 hours) duration (CSS 2024). Long-duration storage can help ensure that a generation mix with a high percentage of variable energy capacity can continue to deliver power when there are long stretches without sufficient wind or solar energy available. However, under current market structures, energy storage deployment has been driven almost entirely by short-duration lithium-ion batteries, which are well suited to take advantage of the variable prices across hours in day-ahead and real-time markets. Research from the National Renewable Energy Laboratory indicates that four-hour storage devices can capture over 80 percent of capacity and arbitrage value in current markets, with the incremental value of adding duration beyond four hours much less than the cost of doing so (Denholm et al. 2023).
Long-duration storage, with intraday and multiday durations, likely will not be sufficiently incentivized by price fluctuations within a 24-hour period. A DOE report estimates that for long-duration storage to take off between 2030 and 2035, a combination of 45–55 percent reduction in capital costs, 7–15 percent round-trip efficiency gains in storage performance, and regulatory supports for the technology will be required (Scott 2023). Staadecker et al. (2024) find through modeling that reducing average energy storage capacity costs to $1/kWh could allow long-duration storage to fully displace other firm low-carbon generation technologies in a net-zero emissions by 2050 scenario. The economics of long-duration storage will likely improve as renewable and short-duration storage penetrations increase, prompting fewer brief price spikes and longer periods of moderately high prices (Mallapragada et al. 2023).
Compared with short-duration storage, long-duration storage may need to take greater advantage of long-term revenue opportunities like capacity markets, where suppliers are paid to be available to provide power when the system is running low on excess supply (Scott 2023). If firm fossil generators like gas and coal are disincentivized through carbon pricing or renewable portfolio standards, the demand for clean energy that can cover any potential supply shortfall will increase. In such circumstances, we would expect capacity market prices to rise, contributing an increasing share of the revenue for firm generators as system operators rely increasingly on rarely used sources for system reliability. Long-duration storage could potentially take advantage of this opportunity but would need to compete with other clean firm resources like advanced nuclear, hydrogen, geothermal, and possibly gas with carbon capture.
3. Policies Supporting Storage
Up to this point, we have discussed the market potential and opportunities for energy storage and how that might drive storage adoption. Because storage is an emergent technology, state and federal policies also play a critical role in supporting its deployment across the United States. Some policies incentivize storage explicitly, while others alter the electricity generation landscape in ways that can enhance the incentives for storage developers. Policy levers can be categorized in several different ways:
- policies that reduce fossil fuel generation
- policies that incentivize clean energy deployment
- policies that specifically support clean firm generation
- policies that directly require storage procurement
Policies that reduce fossil fuel generation could include renewable or clean energy standards, carbon emissions cap-and-trade programs, and emissions standards for power plants. These policies tend to make fossil generators less attractive than cleaner sources and therefore reduce fossil fuel generation and increase fossil generator retirements. To date, most retirements have been concentrated among coal plants, but as standards continue to tighten or cap-and-trade programs become more ambitious, gas plants may be more affected (EIA 2018, 2024). As zero-emissions energy continues to grow, supported by these standards or emissions caps, energy storage may become more prevalent as its competition shifts from traditional fossil resources, like gas and coal, to more expensive clean firm resources that meet the standards, like advanced nuclear, hydrogen, or geothermal.
Energy storage may also take advantage of tax credits or other incentives for clean energy. The clean energy investment tax credits included in the Inflation Reduction Act (IRA) can be leveraged by stand-alone energy storage providers as well as by storage that is colocated with renewables, and in the case of the latter, the renewables remain eligible for the IRA production tax credit. While offering credits only for storage paired with renewables offers greater certainty over the emissions intensity of stored energy, it may limit value delivered to the grid by skewing toward sites where renewables can be located rather than those with the greatest grid need.
Policies may also be implemented in the future that directly incentivize clean firm generation. These incentives would not be available to wind, solar, or even short-duration batteries but would specifically target resources that could help meet reliability needs, like advanced nuclear, hydrogen, geothermal, or long-duration energy storage. The clean hydrogen production tax credit (45V), established by the IRA, is an example of an incentive designed to expand these kinds of resources. Future policies could specifically subsidize resources that are likely to be available when supply of variable resources is low or demand is particularly high. It is not clear how well energy storage would compete among a growing pool of new technologies, but specifically incentivizing clean firm resources in a technology-neutral way could offer greater financial opportunities for long-duration storage, perhaps paired with renewable resources.
Finally, the most direct support for energy storage is through procurement mandates. Table 1 lists states that have renewable portfolio standards and storage procurement mandates with associated deadlines. Renewable portfolio or clean energy standards require a certain amount of energy to come from approved renewable or clean sources (the definition of which can vary by state and may or may not include storage). Storage procurement rules generally require utilities to purchase a specific amount of storage capacity. These rules can be set by state legislatures or public utility commissions.
Table 1. State Renewable Portfolio or Clean Energy Standards Policies and Storage Mandates
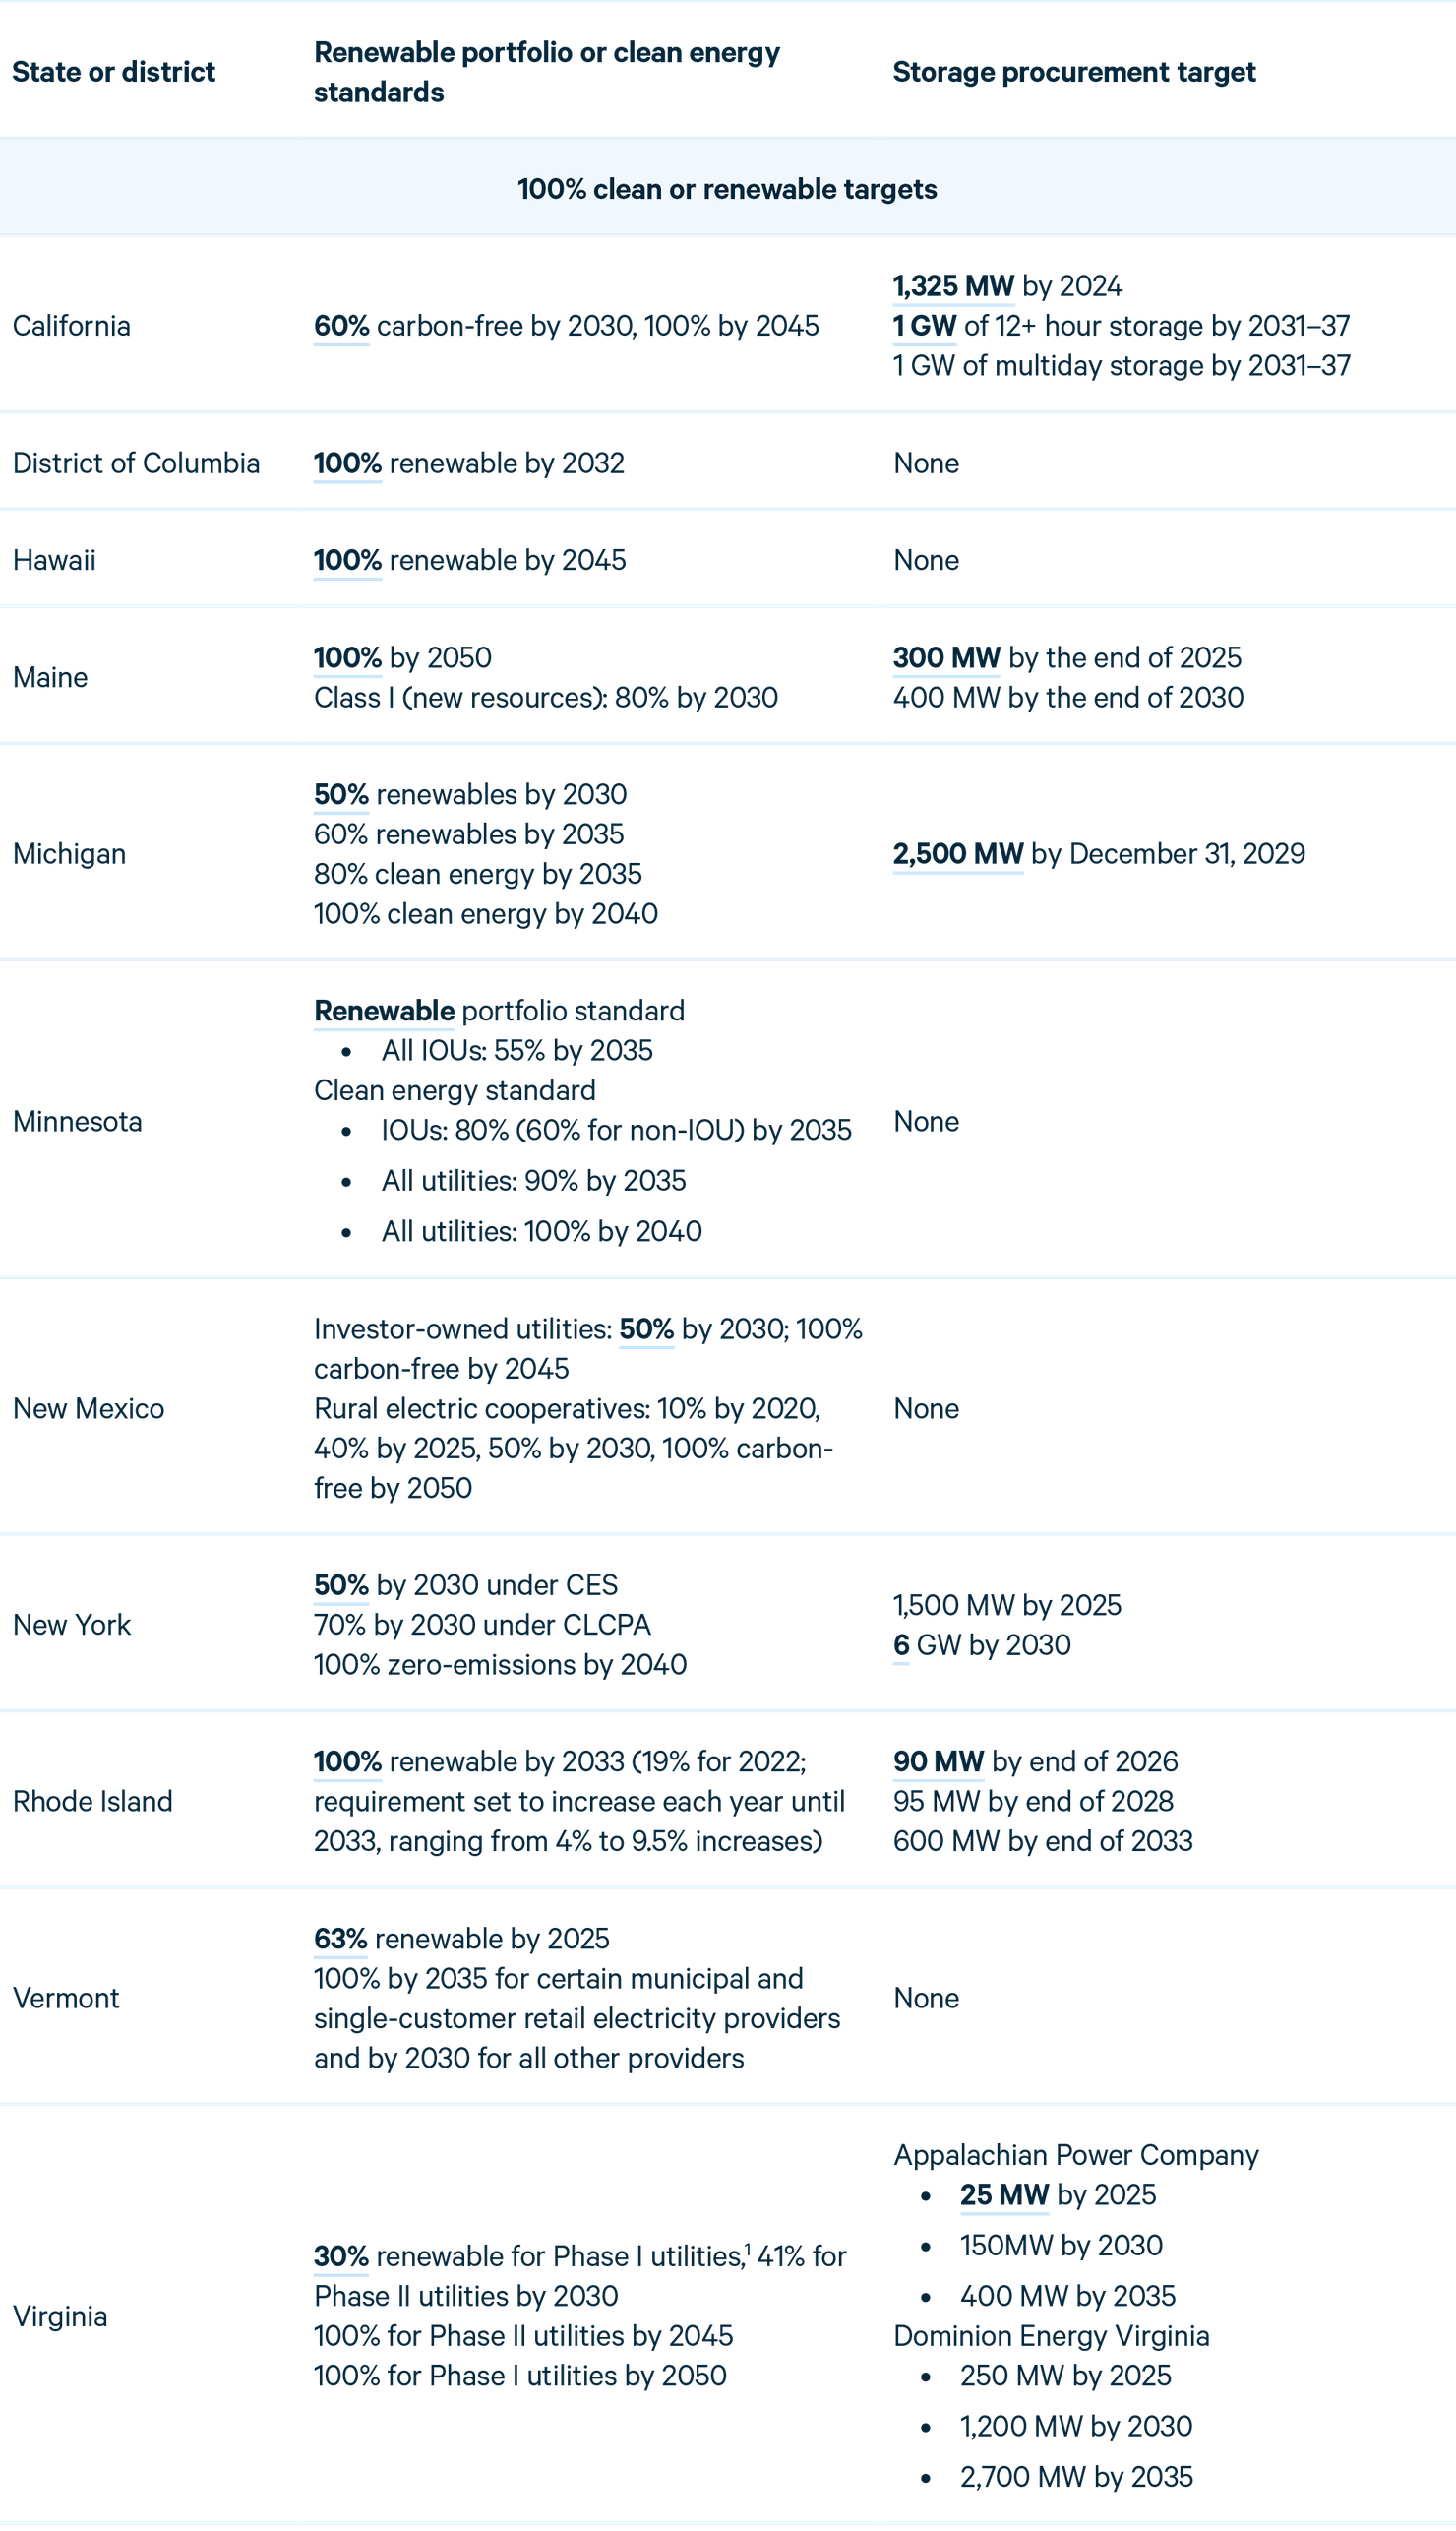
1 According to Virgina H.B. 1526, “A Phase I Utility is an investor-owned incumbent electric utility that was, as of July 1, 1999, not bound by a rate case settlement adopted by the Commission that extended in its application beyond January 1, 2002, and a Phase II Utility is an investor-owned incumbent electric utility that was bound by such a settlement.”
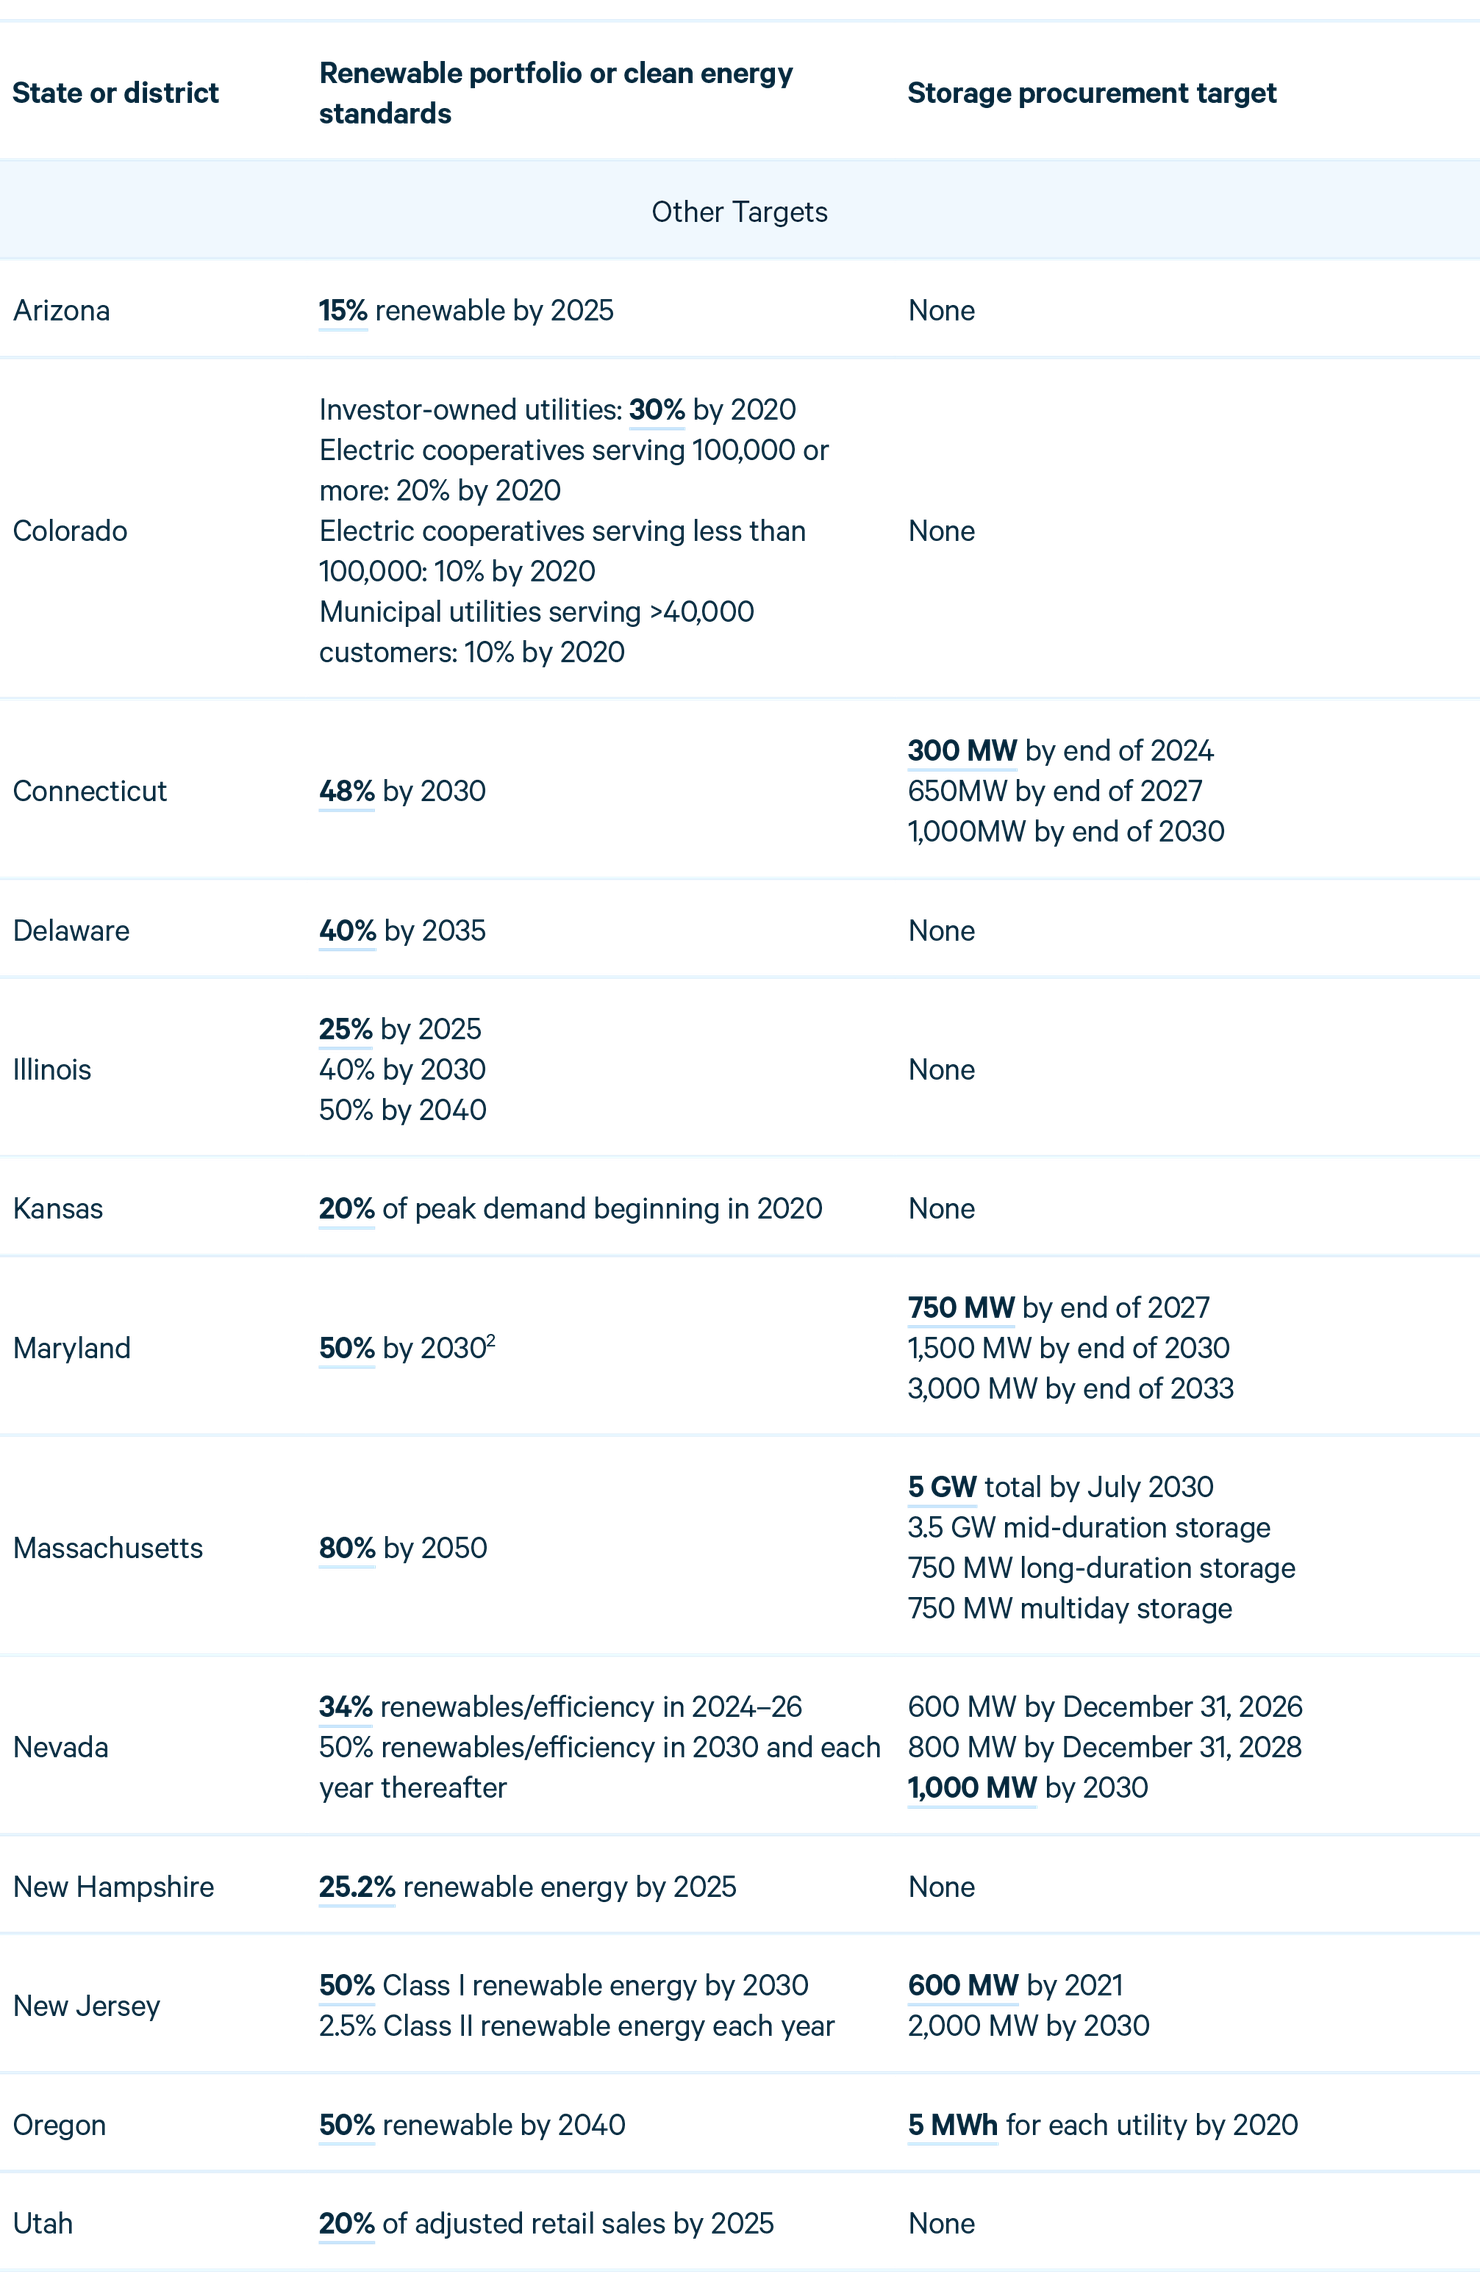
2 Governor Moore issued an executive order in June 2024 that calls for the Maryland Energy Administration to establish a clean energy standard that achieves 100% clean electricity by 2035, but at the time of this draft that has not been formally implemented.
Policies that explicitly mandate storage can help kick-start development of the technology, but they do not typically aim to identify the optimal amount of storage deployment. Instead, they generally set relatively modest targets that require utilities and power providers to do the initial work to integrate storage providers into their planning and operating processes. To encourage the optimal amount of storage in a system, regions rely on either centralized planning or market mechanisms.
4. Competitive Market Rules for Storage
Because electricity market rules are set independently by region, independent system operators can take specific actions that can either obstruct or enhance the opportunity for energy storage owner/operators to collect revenues. System operators define storage eligibility for different market products, interconnection processes, and bidding or accreditation rules for storage owner/operators that affect revenue potential. However, rules in all markets (except Texas) are subject to FERC approval, so operator discretion is bounded. For instance, FERC Order 841 requires system operators to establish rules and regulations to better integrate energy storage providers in energy, capacity, and ancillary service markets. In this section, we discuss competitive market rules for storage and how they might accelerate or constrain grid-scale storage development, as well as the different ways that ISOs can affect opportunities for grid-scale energy storage.
4.1. Interconnection
interconnection request. New suppliers that want to connect to the grid must make a specific request to the RTO and wait for relevant transmission owners to assess their impact on the grid. Energy storage has a slightly more complex relationship with interconnection processes, not only because it offers to supply electricity that could affect grid stability, but also because storage devices, particularly stand-alone storage, act as demand for grid electricity when charging.
In PJM, energy storage faces significant challenges with interconnection (Jacobs 2024). Unlike in other jurisdictions, storage providers in PJM are not permitted to submit their own operating parameters when making an interconnection request, such as committing not to draw power during peak demand periods, when prices are high. As a result, system operators need to assume that storage owner/operators may act as demand during times of system strain, thereby exacerbating grid congestion. Of course, storage providers may be able to deliver additional supply during these times, having the opposite effect and relieving congestion. FERC Order 2023 attempted to improve clarity around interconnection rules for energy storage, but PJM has lagged in addressing this issue, potentially overestimating the risk of energy storage providers overloading the grid.
ERCOT’s interconnection process, in contrast, experiences fewer delays because of its “connect and manage” approach to new generation, which allows generators to connect without paying for costly network upgrades but allows ERCOT to manage its supply as needed to maintain grid stability. For energy storage, this can affect an operator’s charging and discharging preferences and revenue. Overall, facilities can come online faster in ERCOT, but developers may require more time to understand which sites of interconnection have the greatest potential value (Modo Energy 2024). The ERCOT interconnection process takes approximately 3.5 years to complete, compared with an approximate wait time of 6 years in other jurisdictions (Howland 2023).
CAISO has made several recent changes to make its queue more efficient, in compliance with FERC Order 2023. In 2024 FERC approved reforms including identifying zones that have available transmission to accommodate projects, spurring development, as well as zones that require developers to pay for upgrades. CAISO will consider projects for evaluation based on three criteria: project viability, system need, and commercial interest. The commercial interest category is meant to reflect utility procurement mandates in the state, including those for storage (Howland 2024). Across various RTOs, the identification of “fast track” options to accelerate the processing of items in the queue could have substantive impacts on which generation gets built. For example, prioritizing capacity that can help meet clean energy goals could enable a different generation mix than prioritizing capacity that most effectively serves reliability needs.
Storage is also an excellent candidate for using surplus interconnection service (SIS). FERC Orders 860 and 2023 require RTOs and ISOs to facilitate projects that can take advantage of interconnection capacity that is not fully utilized. For example, a solar plant that has 50 MW of capacity but can run only during the day should be able to add supplemental sources of power, such as batteries, that can deliver energy when other capacity is offline without overloading the grid. SIS is a particularly good fit for any renewable or peaker fossil plant that wants to add storage capacity to take advantage of times when its main generator is not running. MISO updated its surplus interconnection service approach in 2021 to enhance its use, and SPP also offers an accelerated timeline for interconnection for projects looking to take advantage of existing interconnection rights. PJM is considered to be lagging in this space, with SIS being underused in the region. Clean energy advocates have expressed frustration with the lack of flexibility in the PJM SIS process, which often concludes that an SIS project would have a negative impact on the grid or other projects in the queue, without conducting studies that consider interconnection of customers’ plans for managing supply (St. John 2024). Following the high capacity prices in 2024, PJM submitted several reforms to facilitate new supply coming online, including updates to the SIS process, to FERC. Those changes were approved by FERC in February 2025 and may help increase battery storage capacity in the region (PJM 2025).
4.2. Compensation for Resource Adequacy
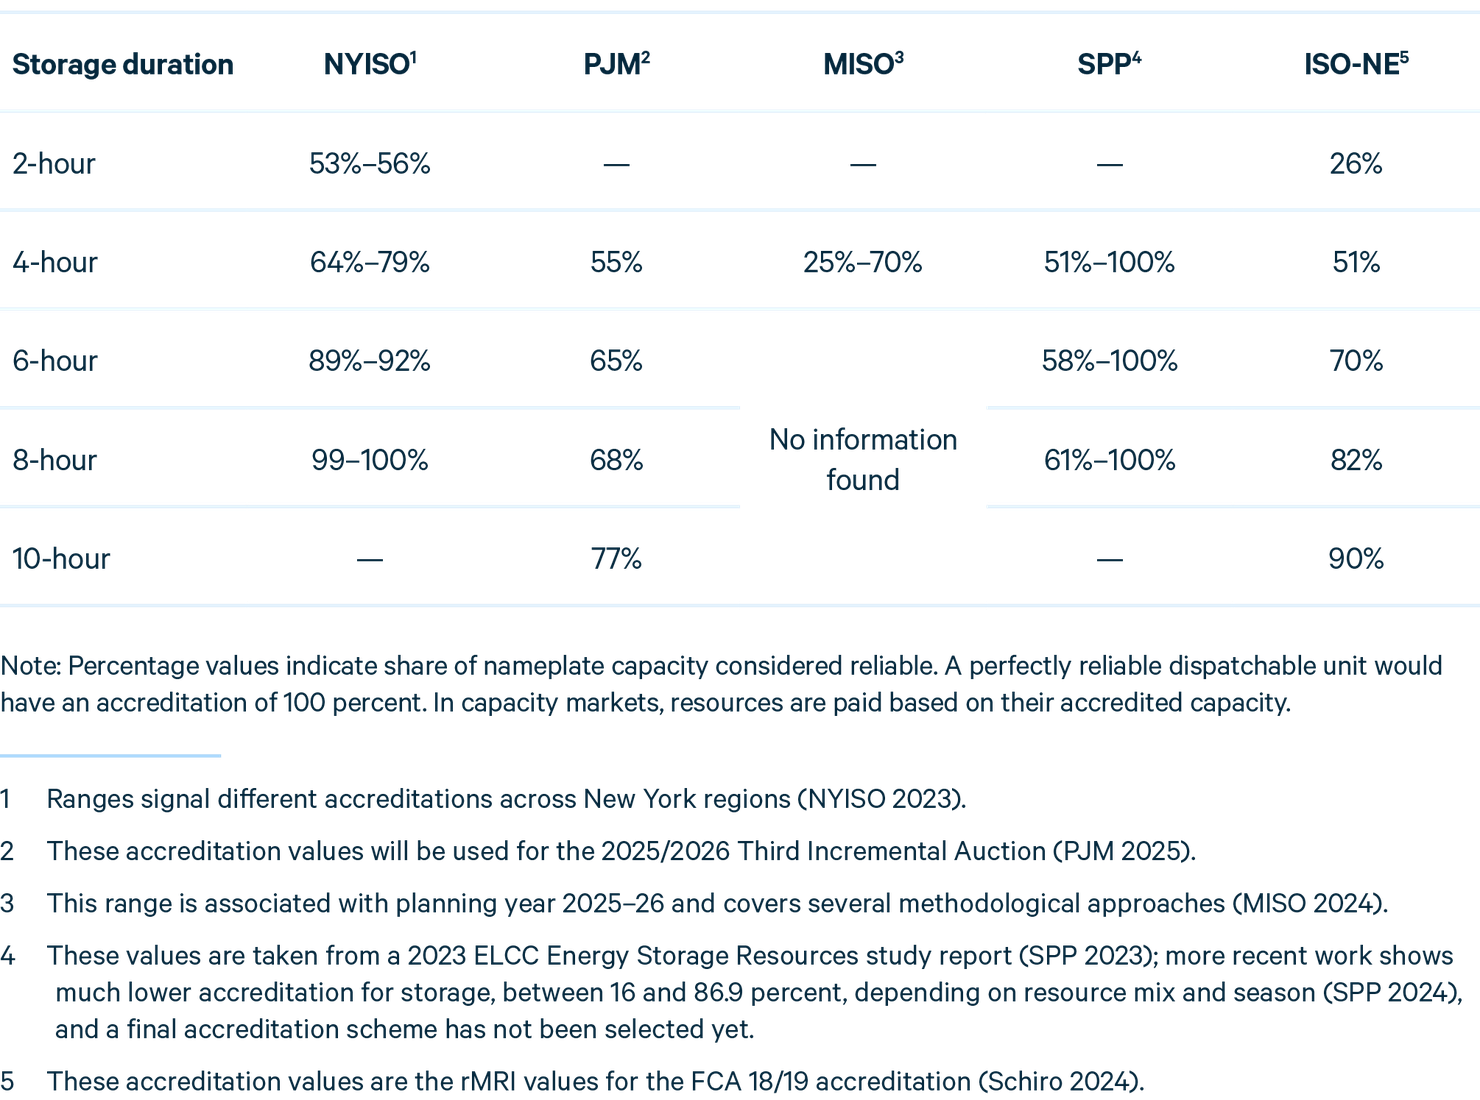
Regions also have different approaches for compensating storage resources for their contributions to resource adequacy. In regions with capacity markets (PJM, ISO-NE, and NYISO) and in regions with other methods for securing sufficient resources, energy suppliers are often “accredited” at some rate that adjusts their installed capacity to some amount that better reflects their contribution to resource adequacy. Accredited capacity of a resource is lower if it is less likely that the resource can offer supply when demand is high or supply is low. Each region has a different approach to accreditation, using different models, time frames for analysis, and underlying assumptions. Different regions also have different load profiles and resource mixes that can affect the marginal contribution of any given energy supplier to reliability. The result is that stand-alone storage faces different levels of capacity adjustments in different markets. Table 2 shows different capacity adjustments for different durations of storage by ISO. Some of these are estimated figures or are still under development and review, but the table offers evidence that storage accreditation varies substantially across regions, in terms of both the types of storage eligible to supply capacity and the levels of accreditation. These accreditations are subject to change over time as renewable generation and energy storage capacity increase in the region.
Table 2. Energy Storage Resource Capacity Accreditation by Region
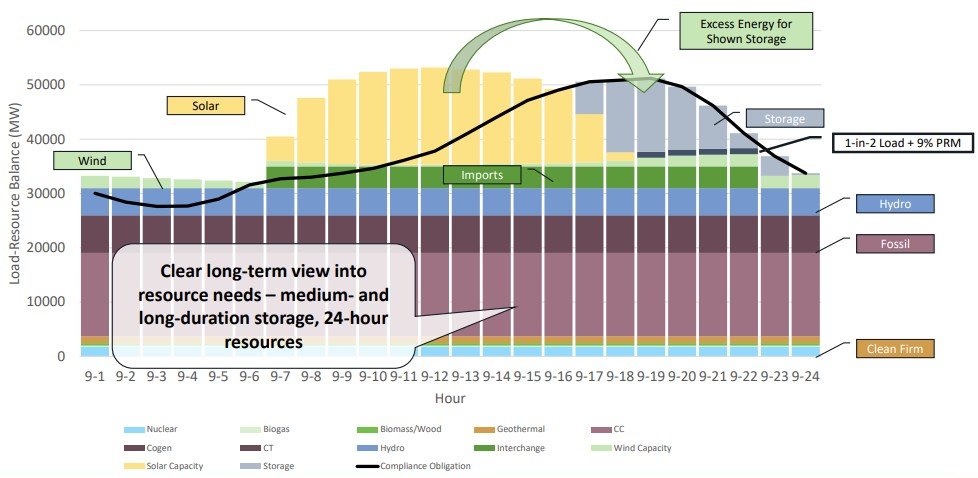
California does not have a formal capacity market but delegates responsibility for contracting for resource adequacy to load-serving entities, which must meet specific requirements. In addition to some resource-specific valuations based on forced outages, California has adopted what is referred to as a “slice-of-day” approach to determine whether a load-serving entity has the right mix of resources to meet demand in every hour of the day. The slice-of-day approach matches hourly supply profiles to hourly load profiles, with special consideration for excess supply that can be leveraged by storage resources. Figure 4 shows a representative day under the slice-of-day framework (CPUC 2022). Experts in a 2022 RFF workshop suggested that the framework could be particularly beneficial for short-duration storage resources in areas with significant solar capacity, which capitalize on excess energy in the afternoon and higher load in the evenings. Because the slice-of-day approach matches supply and demand across a 24-hour window, multiday outages that would require long-duration storage or other solutions may be underconsidered (Robertson et al. 2022).
Figure 4. Illustration of California’s Slice-of-Day Resource Adequacy Framework
Source: Pappas (2023).
Note: CT= simple cycle gas turbine; CC= combined cycle gas turbine; PRM= planning reserve margin.
The Texas grid operator ERCOT notably does not have a capacity market or load-serving entity-level contracting obligations. ERCOT operates what is referred to as an “energy-only” market, where suppliers collect revenue only in the day-ahead and real-time markets and are incentivized to develop resources that serve load in times of system stress through high scarcity prices. Instead of ERCOT assessing which resources are most likely to be available when demand spikes or supply dips and paying those resources in advance to be available, the market design seeks to ensure that prices will be exceptionally high in periods of shortage, and if suppliers can capture those prices, they will factor that opportunity into their investment decisions. For storage resources, this places a greater emphasis on price arbitrage as a means of collecting revenue. The closest proxy for a capacity payment mechanism in the Texas market comes from the operating response demand curve (ORDC), which offers increasing payments to suppliers that offer to provide energy during times with low reserves. The lower the generation reserves, the higher the ORDC payments to operating suppliers. Figure 11 shows that in the past two years, only a minimal amount of storage revenue is attributable to ORDC payments in ERCOT.
4.3. Bidding Rules
Grid operators can also set rules that dictate how suppliers should operate in wholesale markets. For energy storage, which alternates between acting as demand and acting as supply, market participation is a bit more complex than for generators. Generally, storage owner/operators submit bid and offer spreads in the energy market, which establish the prices at which they would purchase power to charge and at which they would discharge and sell energy into the market. There is usually a gap between these two prices where battery operators would hold charge until higher prices come along and make it more profitable to sell (CAISO 2024). While traditional generators are thought to bid their marginal cost of generating energy in competitive markets, economists expect battery operators would set their selling price based on the opportunity cost of discharging. In other words, if a battery operator expects to be able to sell a MWh for $50 at 5 p.m., the operator may not be willing to sell it for $20 at 4:50 p.m., even if the marginal cost of charging that MWh is less than $20.
Figure 5 shows bidding behavior by storage device owner/operators in CAISO throughout the year in 2023, with an average spread between charge and discharge prices of $235 per MWh (CAISO 2024). The variation in the orange line shows how storage owner/operators respond to the opportunity cost of discharging as prices fluctuate. The CAISO report also noted a sizable share of bids to discharge at the price ceiling of $1,000/MWh in the real-time market, though most bids were under $100/MWh. Across a range of sample days, at 9 p.m., about 5–15 percent of bids were at the price ceiling. For the same sample days, at 12 noon, about 15–30 percent of bids were at the price ceiling (CAISO 2024). In 2024, FERC approved new CAISO rules that allow storage bids to exceed the $1,000 price cap to reflect intraday opportunity cost, permitting bids up to $2,000 MWh. Those high bids often reflect storage owner/operators’ confidence that the relevant period will not be the highest price point in the day. However, bidding behavior of storage resources challenges traditional methods of market power mitigation, because it is difficult to estimate opportunity costs in the presence of price uncertainty, storage state of charge constraints, and energy price caps (Xu et al. 2024).
Figure 5. Hourly Average CAISO Day-Ahead Bids and Nodal Prices, by Quarter
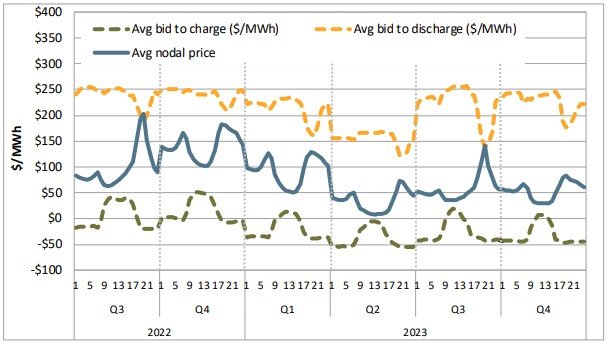
Source: CAISO (2024).
To mitigate market power by energy storage, CAISO has implemented a default energy bid (DEB) policy for discharge offers that considers opportunity cost and storage operating cycles. Charging bids are not subject to mitigation, which is a potential weakness. As is the case with thermal generating resources in the CAISO’s local market power mitigation system, the DEB may replace supply (discharge, in the case of storage) offers in circumstances where the potential for significant local market power is detected by certain network constraint screening procedures. The DEB calculation for storage, used in instances of potential market power, allows schedulers to put a shadow price on the value of stored energy and consider that in the dispatch optimization. Figure 6 illustrates how the DEB is calculated. The charging bid behavior (blue) represents demand for energy, while the discharge bids (red) represent the storage operator’s willingness to act as supply. The figure shows an example DEB that considers the cost of energy purchased plus cycling costs and opportunity cost of arbitrage in the real-time market, maximizing profit opportunity while considering state of charge requirements. The opportunity cost component is set by resource duration. The real-time opportunity cost is the fourth-highest anticipated LMP in the day-ahead market for a four-hour battery. However, real-time conditions may differ from what is anticipated day-ahead, so the fourth-highest day-ahead cost may significantly under- or over-estimate the actual opportunity cost in real-time. The cycling costs are informed by specific battery specifications and the way they were designed to operate (CAISO 2020).
Figure 6. Illustration of CAISO Default Energy Bid
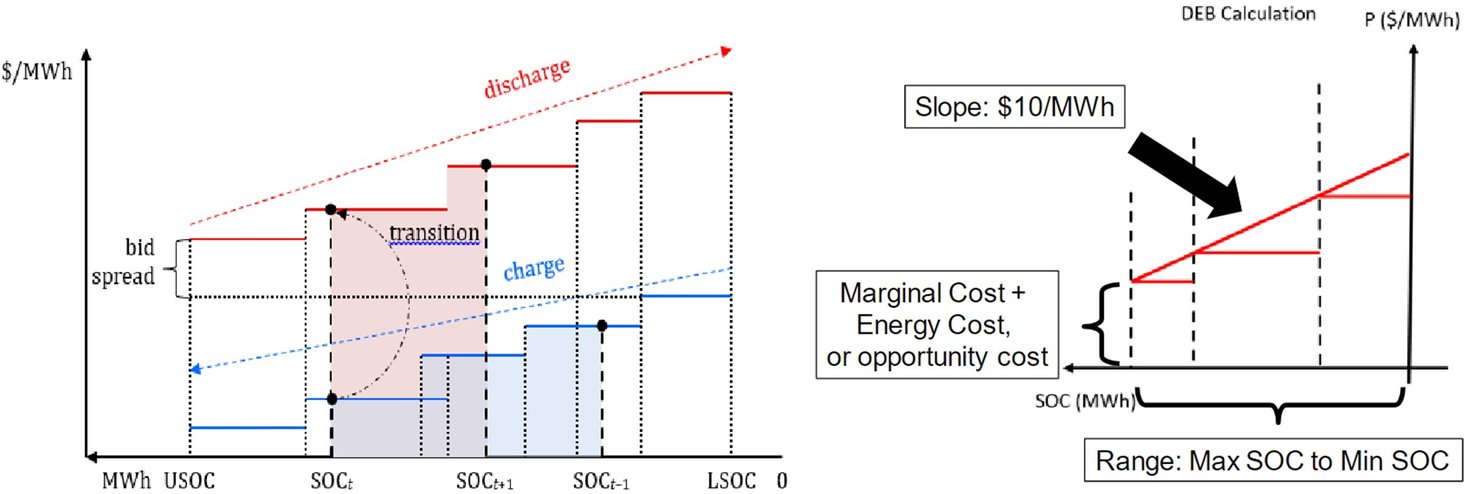
Sources: Zheng et al. (2023); CAISO (2022).
Market power mitigation did not have a significant impact on storage dispatch in 2023. Figure 7 illustrates that most MW of storage were unaffected (blue), some had bids that were affected but the dispatch was not affected (orange), and only a small portion of MW (red) were dispatched because of mitigation efforts that automatically adjusted bids to supply downward (CAISO 2024). However, an analysis of bidding behavior in 2024 indicates that even within these operating parameters, battery storage operators may be withholding offers in the day-ahead market to capitalize on price spikes in the real-time market. While there may be many reasons for this behavior, it highlights the complexity of addressing market power mitigation for battery storage while maintaining the incentives for storage to save energy for when it is most needed (Ma et al. 2025).
Figure 7. Hourly Average CAISO Day-Ahead Battery Supply Changes due to Market Power Mitigation, 2023
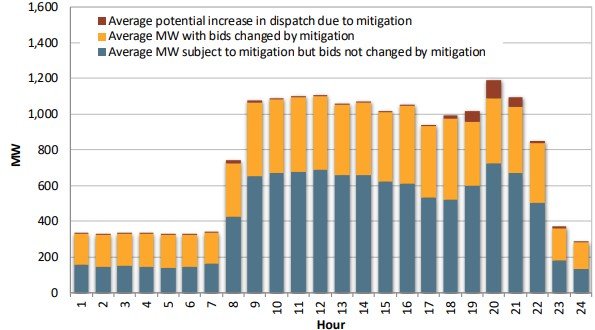
Source: CAISO (2024).
4.4. State of Charge Requirements
Most ISO markets explicitly model the state of charge of participating battery storage to ensure that battery charging and discharging schedules selected by the market software are feasible. This may include estimating typical charging and discharging behavior across different products, including ancillary services. Different strategies can be used to incorporate storage operational limits to market operations. These include allowing storage owners to make offers and bids that reflect storage owners’ own estimates of opportunity costs; allowing owners to self-schedule their discharging and charging, or to specify a target state of charge for a specified future time; and allowing system operators to “exceptionally dispatch” storage, overriding self-schedules or market schedules. Markets today allow storage operators to reflect energy constraints in their offers and bids but also may have minimum state of charge requirements to secure some operational certainty over energy availability from storage.
State of charge requirements vary by market. ERCOT’s require storage resources to have full charge to meet any ancillary service obligation at the start of the operating hour. The state of charge requirement declines linearly throughout the operating hour and then returns to the full obligation at the start of the next operating hour. This requirement may sometimes cause storage providers to charge at inopportune times to meet their state of charge requirement, as otherwise they will forgo meaningful opportunities to participate in ancillary service markets (Vermillion 2023a). The ERCOT board and utility commission approved these new state of charge requirements earlier in 2024, after substantial conflict with storage developers who claimed it would make operation more complex and could slow storage growth in ERCOT. The compromise agreement removed the compliance and penalty instruments that were originally included in the proposal. ERCOT is actively working on an initiative to co-optimize real-time and ancillary service markets, which would integrate state of charge considerations into the real-time dispatch (Parakkuth 2024).
CAISO also has state of charge requirements for storage that provides ancillary services, but rather than a full-capacity requirement at the start of the hour, with a gradual decline, storage operators must hold a state of charge to accommodate 50 percent of their requirement at any given time within the operating hour. For example, if a resource has a 50 MW award for regulation up during a particular hour, the CAISO state of charge constraint states that the resource must be able to discharge at least 25 MWh of energy within the hour (Murtaugh 2022). The state of charge requirements are intended not only to govern the behavior of the storage operator but also to be reflected in the optimal dispatch instructions provided by CAISO.
Actively managing state of charge in CAISO has led to some additional challenges in implementing bid cost recovery. When dispatch instructions vary from bid and offer parameters, CAISO uses bid cost recovery (BCR) to pay back generators for potentially lost profits. However, when state of charge causes real-time dispatch to vary from day-ahead schedules, storage owner/operators may end up receiving bid cost recovery windfalls that do not correspond to their true availability to deliver energy in real-time. This in turn creates incentives for storage owner/operators to structure their day-ahead bids to capitalize on real-time BCR (Bushnell et al. 2024). In response to escalating payments to storage providers, CAISO reformed its BCR system at the end of 2024.
Some storage owner/operators with extensive experience may prefer to manage their own state of charge, even if they face penalties for not meeting their product obligations. Other, newer entrants may prefer state of charge to be managed by the system operator to reduce penalty risk. In general, state of charge requirements may be the result of conservative system operators that want to integrate new technologies as seamlessly as possible.
Ultimately, market rules for storage participation are intended to increase competition and make the best use of the resource type without creating openings for market power or showing preferential treatment for the technology. However, these tools are complex and may need to be consistently re-evaluated, as they can lead to unintended consequences by creating or removing profit opportunities. Challenges will continue to emerge as more storage resources come online, and market design and regulations could play an important role in ensuring that energy storage resources are appropriately incorporated without interfering with critical market functions.
5. Evidence on Storage Deployment in the US
While existing research offers insights on the theoretical value and limitations of energy storage, data on real-world deployments illustrate which environments are most favorable for the technology. Utility-scale storage is starting to expand in the United States, most notably in California and Texas. Several factors could be driving the differences in the rates of growth of storage capacity across various regions: the increase of intermittent resources that enhance the opportunity for price arbitrage, exposure to market designs that facilitate storage participation, and state policies. In this section, we offer data on the state of the storage market in the United States and discuss potential drivers.
5.1. Regional Variation in Growth
The greatest growth in battery storage has occurred in two markets: ERCOT and CAISO. Figure 8 shows the larger additions to storage capacity in these markets compared with other regions. The differences across regions have increased exponentially since 2020, with most of the storage additions happening since 2021. These figures show data through 2022, but the trend has continued in recent years. The EIA reported that nationwide battery storage capacity increased by 66 percent in 2024, with 60 percent of those additions realized in California and Texas (EIA 2025, Thomas 2025). Growth in western states with clean energy goals like Arizona and Colorado has also increased rapidly since 2022, with many planned additions on the way in 2025 (Thomas 2025).
Figure 8. Annual Storage Additions from 2010 to 2022
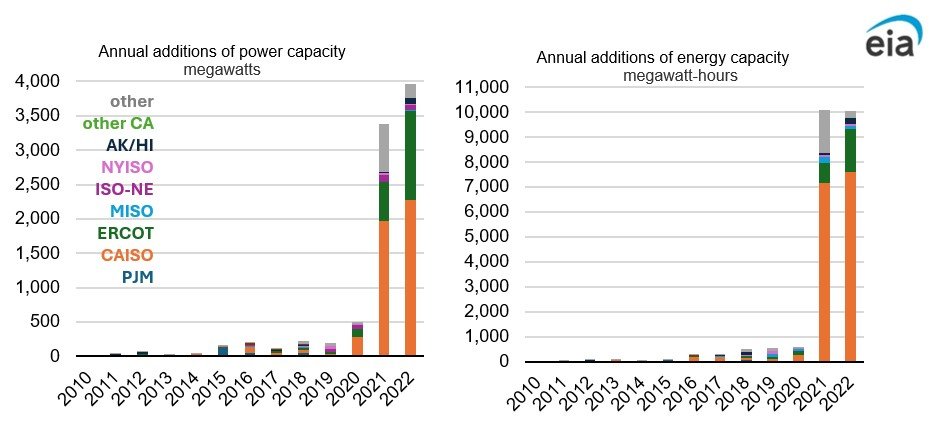
Source: EIA (2023a).
There is not much overlap in the policy or market landscape to indicate a common driver moving storage capacity investment forward in California and Texas. California has robust policy supports for storage, including minimum mandates for utility storage deployment and power sector policies that drive renewable energy more broadly, including a clean energy standard and a CO₂ cap-and-trade program. In contrast, Texas has no formal statewide policy supports for storage or renewable energy in the power sector. Texas adopted a renewable portfolio standard in 1999, but it reached its 2025 goal in 2009 and has not increased in ambition. Renewables have been significantly supported by the CREZ transmission line in Texas, which transports wind power from the west to load centers in the east. Instead, it has a market design that enables more price variability in the energy market and a more flexible approach to new generator interconnection that has been shown to bring new units online more quickly (Howland 2023).
New York is a region to watch for storage growth, as its policy landscape is shifting toward the California approach. The New York climate law, the Climate Leadership and Community Protection Act, adopted a more aggressive clean energy standard for the power sector, as well as energy storage mandates. In the coming years, New York’s storage growth path may look like the observed trend in California.
While no other US jurisdictions have adopted the connect-and-manage approach to interconnection favored by ERCOT, FERC Order 2023 requires ISOs and RTOs to take steps to improve interconnection processes and speed the process for bringing new generation online. Reforms will likely vary across jurisdictions and be implemented on different timelines. It remains to be seen how interconnection reforms, including enhanced use of surplus interconnection, may stimulate storage capacity across the United States.
5.2. Storage and Variable Generation
The regional variation in storage investment described in Section 5.1 may be driven in part by variation in variable resources joining the grid. Demand for ancillary services and price arbitrage in the energy market are both affected by the number of variable inverter-based resources on the grid. Using the EIA data, we consider the ratio of storage to variable energy by region. If storage deployment were driven solely by the amount of variable generation, we would expect this ratio to be similar across jurisdictions.
Figure 9 illustrates that this is not the case. CAISO has the highest ratio of storage energy capacity to wind and solar capacity, with approximately 0.76 GWh of battery storage for each GW of solar capacity, while MISO and PJM have the lowest ratios. Even though MISO has a large wind fleet, storage has yet to grow significantly.
The data also indicate that solar capacity generally has a stronger relationship with storage than does wind energy, likely because of the more predictable nature of solar peaks and valleys, in addition to the relationship between demand curves, supply availability, and average storage duration. Two-to-three-hour lithium ion batteries are very effective in extending solar capacity from peak supply times to windows of high evening electricity demand.
Figure 9. Ratio of Storage Energy Capacity to Wind and Solar Capacity, 2023
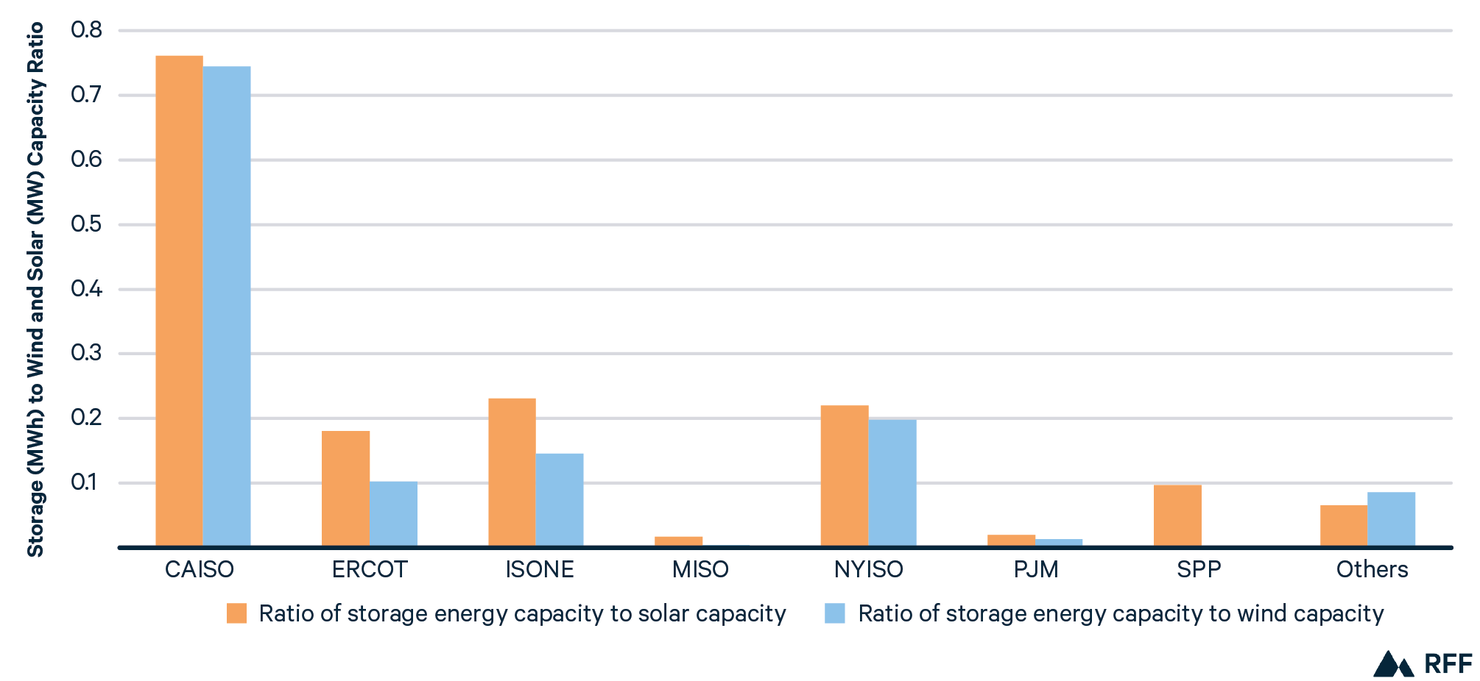
Source: EIA (2023b).
The variability in the ratio between storage capacity and variable resource capacity offers some evidence that policies and market rules to support storage are likely playing a role in storage deployment that goes beyond the symbiotic relationship between variable resources and energy storage.
5.3. Storage Capacity by Product Class
Data from EIA show that most of the energy storage capacity is being used for energy arbitrage and ancillary services. Figure 10 illustrates the power and energy capacity by product type and by market. Frequency regulation, spinning and ramping reserves, and energy arbitrage were the most common uses for energy storage in 2022. California and Texas both follow these product trends.
Figure 10. Applications Served by Utility-Scale Battery Storage, 2022
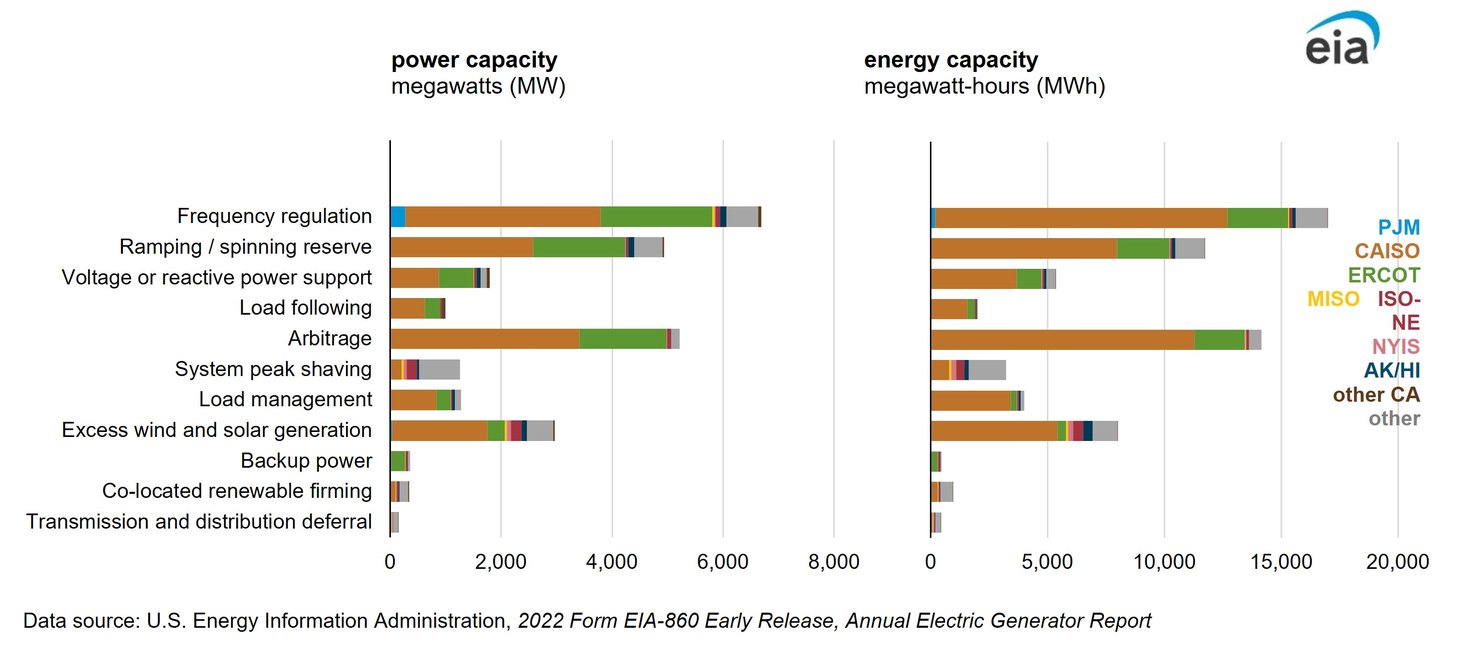
Source: EIA (2023a).
While the EIA data suggest that energy arbitrage accounts for similar or larger shares of capacity compared with several ancillary services, ancillary services dominate the revenue stack for storage in ERCOT. Figure 11 shows the share of storage revenue in ERCOT accruing to each of the competitive products. While energy revenue grew between 2022 and 2023, ancillary services continued to contribute most of the revenue for storage providers (Vermillion 2024). The responsive reserve service (RRS) requirement makes up the largest portion of revenue for storage, particularly before the ERCOT Contingency Reserve Service (ECRS) was introduced in 2023. These products deal with frequency regulation, but the ECRS was introduced to deal specifically with longer-duration frequency challenges prompted by increased variable generation (Fisher et al. 2024). These revenue estimates offer evidence for why state of charge or other constraints on storage operation in ancillary service markets can lead to substantial changes in storage revenue.
Figure 11. Percentage Breakdown of Total ERCOT Revenues for Storage Resources
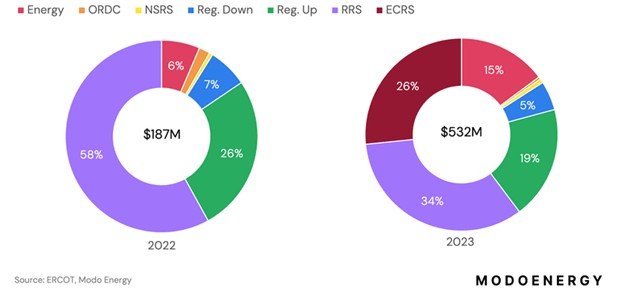
Source: Vermillion (2024).
Note: ORDC = operating demand response curve; NSRS = non-spinning reserve service requirement; RRS = responsive reserve service requirement; ECRS = ERCOT contingency reserve service.
A slightly different story can be observed in CAISO. Figure 12 shows the revenue per kilowatt-year for energy and ancillary services. More than half of the revenue for storage resources is coming from the energy markets in CAISO. And the net revenue per kilowatt-year was lower in 2023 than 2022 because of lower energy prices, even though the total spending on batteries increased by 22 percent (CAISO 2024).
Figure 12. CAISO Revenue by Product Type for Battery Storage
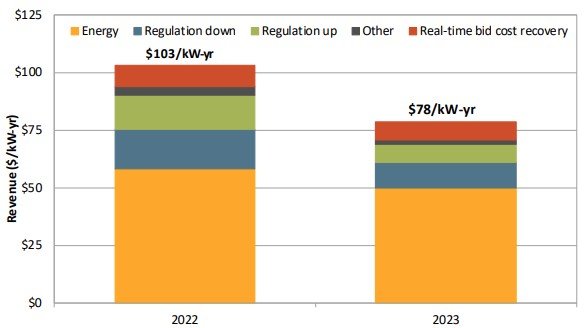
Source: CAISO (2024).
5.4. Drivers of Adoption
After reviewing the storage growth trends across regions in the United States and considering our findings across the review of the market and policy landscapes, the emergence of Texas and California as storage hubs reveals interesting insights. From a policy and electricity market perspective, the regions are quite different. California has a robust set of policies to support storage, while Texas has no storage mandates or 100 percent renewable requirements. Texas has an accelerated process for interconnection, which allows developers who see profit opportunities to act relatively quickly to join the grid. Both regions have significant wind and solar generation, which seems to be an important driver of storage profitability. While the revenue stack for storage looks different in the two regions, different products and market rules like state of charge management and market power mitigation can influence revenue for storage owner/operators. Ultimately, landing on clear and consistent market rules that enable efficient storage utilization could provide more certainty for developers and serve as a blueprint for other market operators managing growing storage participation. As the policy landscape continues to evolve across different states, and market reforms like those related to interconnection are implemented, storage developers may respond by investing in new territories.
6. Conclusions
Energy storage can offer a variety of valuable services to the grid. Short-duration storage has taken off as a competitive provider of selected ancillary services and has begun to play a role in intraday price arbitrage in some regional markets. Currently, storage growth seems to be limited by a few key factors. On the economics side, intraday price variation in wholesale markets has offered only limited arbitrage opportunities, and some ancillary service markets, like those in Texas, may be nearing storage saturation. On the policy side, only a handful of states have policies specifically promoting energy storage, and clean or renewable portfolio standards do not typically include energy storage. While federal tax investment credits were expanded in the Inflation Reduction Act to include stand-alone storage, incentives that specifically target clean firm resources like long-duration storage have not materialized. Finally, in some jurisdictions, market rules like those governing interconnection queues and approaches to market power mitigation may limit the pace of storage investment and revenue opportunities. We didn’t explore siting challenges in this review, but local opposition and permitting restrictions have also emerged as a roadblock to storage development (Eisenson et al. 2024).
Longer-duration storage faces even more hurdles, as the ancillary services and interday arbitrage opportunities do not offer an economic payoff for this more expensive form of storage. Only California has specific resource mandates for longer-duration storage technologies, and it is not clear what market products, other than forward capacity, long-duration providers will be able to capitalize on. Industry experts have also stated a need for additional financing support for these new technologies because of higher risks of technology nonperformance that are difficult to ensure against for very new technologies.
Ultimately, storage will likely play an important role in balancing a variable renewable energy system, alongside interregional transmission and more flexible and price-responsive demand. It is not clear how much storage will be needed and whether policies currently in place are sufficient to elicit the optimal amount of storage investment. What is evident is that economics, public policies, and market rules each play a role in making certain regions hospitable to storage investment. Policies and market rules may over- or underincentivize investment in energy storage and affect the fundamental economics of the technology.
This work has identified some important features of the landscape for utility-scale storage deployment and revealed potential avenues for new research. First, while economics, policy, and market rules can all impede storage deployment, it would be valuable to understand which barriers to storage investment are most consequential. If economic value is the main constraint, policy interventions may be less important than if market rules are preventing optimal deployment. Second, we observe a mix of technology-specific and technology-neutral policies that could support storage. Storage developers may prefer technology-specific mandates, but what is the appropriate blend that will help kick-start storage integration without overincentivizing storage above other solutions to supply volatility? Third, research is needed to determine how market rules need to evolve to fully capture the flexible value of storage while maintaining operational certainty over the grid. State of charge management and market power mitigation may require creative solutions to best use storage resources. Finally, it would be helpful to explore how short-duration storage investment growth can or cannot inform a practical approach to supporting long-duration storage. The economic value proposition is quite different, and it remains to be seen what kinds of policy incentives or market products might spur investment in long-duration storage.